Team Status Report for 12.09.23

The most significant risks right now are regarding integration and testing. For integration, as we finalize our ML models we don’t have as much time as we might want when it comes to debugging. This week we have been running into many issues with integrating our systems, whether it has to do with incompatibilities, file path issues, or more. We will be working hard throughout the weekend and until the demo in order to finalize our integration. Along with this risk comes the risk of not having enough testing. If we don’t finish our integration in time, we will not be able to conduct thorough testing of our complete system, and also won’t be able to conduct thorough user testing. As mentioned last week, if we cannot test tomorrow we will likely have to test during the demo on Monday so that we can include our results in the final report.

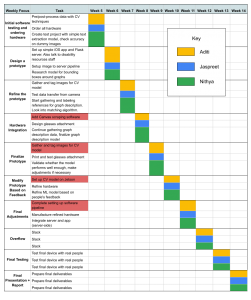
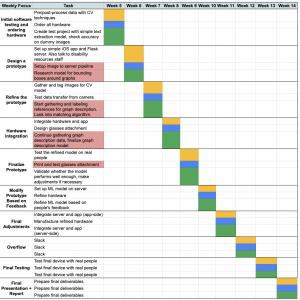
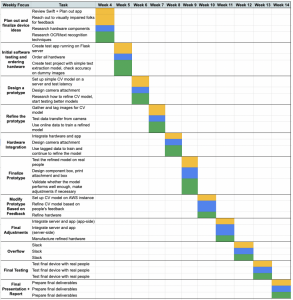
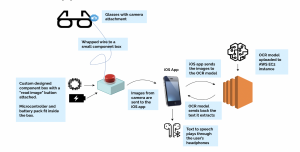
We have not made any changes to the design of our system since last week, and have not updated our schedule.

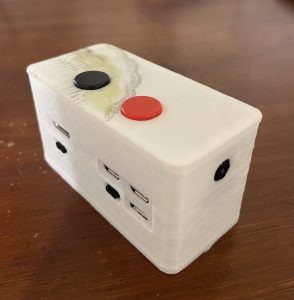
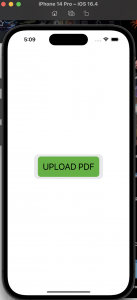
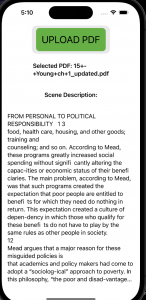
For our latency tests, we measured the time between the button press for starting/stopping audio, and the result. We took 10 trials and averaged the results. For the start button latency, we measured an average of 5 seconds, and for the stop button latency, we measured an average of 60 ms. It is worth mentioning that these latencies are dependent upon the network delay and traffic at the time.

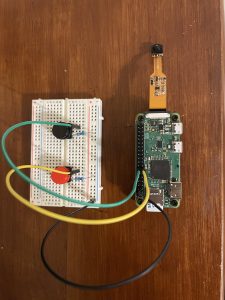
For our weight and size measurements, we simply used a scale and a ruler. The weight of our attachment was 86 grams, and the size was 76 mm by 42 mm by 37 mm.

For battery life, we measured a minimum battery life of 5 hours when the device was being used constantly. This was after testing the battery on 5 separate occasions.

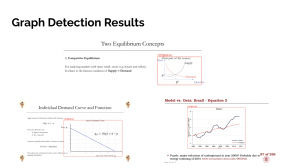
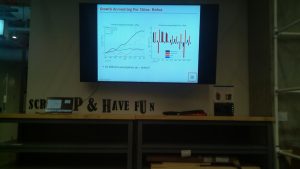
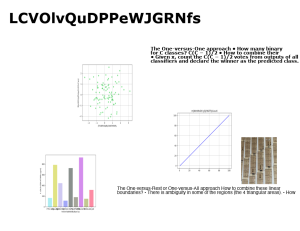
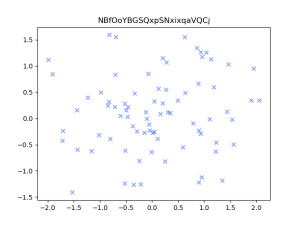
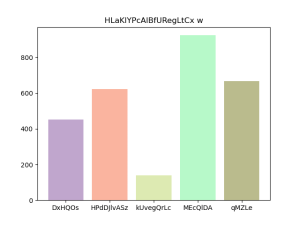
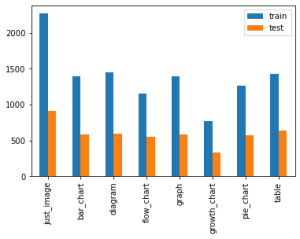
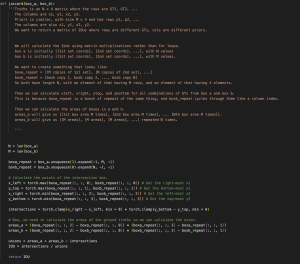
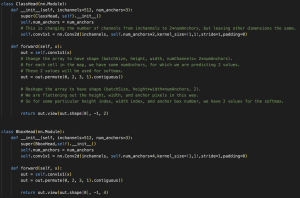
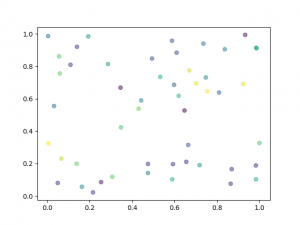
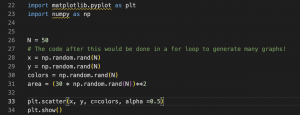
For our graph detection ML model, we gathered around 2000 real images of lecture slides which we split into a training and validation set. The validation set had a size of about 100 images and our unit tests involved testing whether the graph detection model was able to detect good bounding boxes around graphs in the slides. To measure the accuracy of this, we used mean intersection over Union as a metric – calculating the overlap / total area of the predicted and true bounding boxes from what we labeled. We found that all graphs were accurately detected (100% detection rate) and the mean IOU was about 95%, so bounding boxes were pretty good about capturing the whole graph.

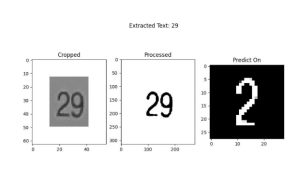
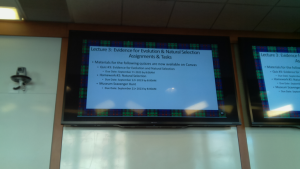
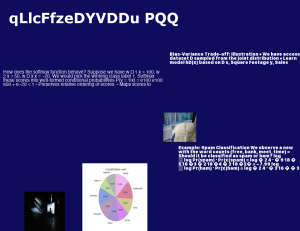
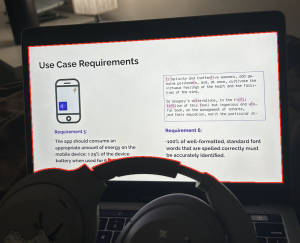
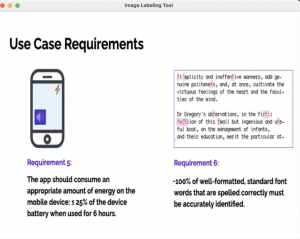
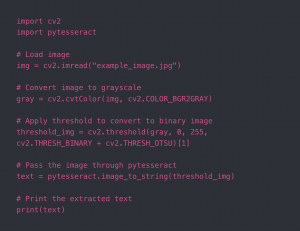
For our slide matching ML model, unit testing involved taking a validation set of 110 images from the images of slides we captured with our device in TechSpark. We then tested both components of our slide matching system. First, we tested the detection of bounding boxes around the slide number on the slide. These numbers were detected with 100% accuracy. We then took the cropped images of the slide number boxes and then ran a second model on them in which we did preprocessing and then classification of each digit. These tests revealed an accuracy of 73%, so our total accuracy for slide matching from unit testing is 73%.

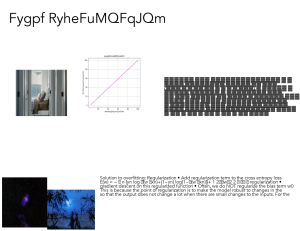
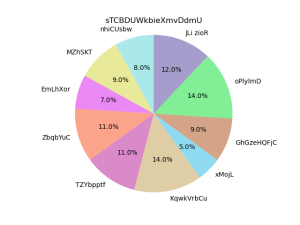
For our graph description ML model, our unit tests involved measuring the mean accuracy in terms of token-to-token matching with the reference descriptions. We did this on a set of about 75 graphs out of the graphs we extracted from real slides, and this revealed an accuracy of 96%.

Jaspreet’s Status Report for 12.09.23

This week, I continued to help with gathering images to test and train our ML models. I went to TechSpark and gathered about 400 total images of presentation slides being displayed on a large monitor. These slides had differently formatted slide numbers at the bottom right, and testing with these images helped us determine which format would be best for our slide matching model. I also added clips onto the side of our component case so that it can now attach to the side of glasses. However, in the middle of the week I tested positive for COVID, and I was unable to work for multiple days due to my sickness.

Similarly to last week, since our team’s progress is behind schedule, so is mine. Since we have not finished integration, I still have to place our code on our Jetson, and the plan is currently to do so on Sunday once integration is finalized. As a team, we must complete integration before the demo on Monday. Furthermore, we must complete user testing of our system either before or during the demo on Monday. After this, what remains is completing the final deliverables for our project.

Aditi’s Status Report for 12.09.23

This week, I focused mostly on integration. I was able to fix all of the bugs with integrating the slide matching model, and am continuing to integrate the graph description model. I also worked on the final portfolio, and worked on the script for the final video.

Tomorrow, before the final demo, I need to finish up integrating the graph description model, and our team needs to perform some user testing. We are still behind schedule because we have not finished the graph description and the integration, but we hope to do this before the demo.

Nithya’s Status Report for 12.09.23

This week, I finalized and retrained/saved the graph detection and slide matching models, continuing to make changes to hyper parameters and values for pre-processing. The main task this week was dealing with issues in the graph description model. I was able to train the model last week and get results on input scatterplots and line graphs, and during the same run, visualize results. However, when I tried to save the model and reload it (so that we wouldn’t have to retrain every time we wanted results), I faced several issues. The root of these issues is that in Keras, only the most basic type of model (a sequential model with fully connected or convolutional layers) can be saved and loaded in this way. Since my architecture is significantly more complex and consists of a CNN followed by an encoder/decoder network, Keras would not allow me to save and reload the model with its weights after training to be used for inference.

I spent several days trying to work around this issue by looking into the Keras documentation and Stack Overflow, but in the end decided that it would be better to use a different framework for the model. I then translated all of my code into PyTorch, in which it is much easier to save and load models. I then retrained the model.

Once I did this, I also worked on the integration – I completed the slide matching integration with Aditi earlier in the week, and I worked on the graph detection and description pipeline (I had to combine them into one full system since we are using the extracted graphs from detection for the graph description). This pipeline is now complete.

I finished on schedule and all that is left for this coming week is to try to make minor tweaks to perhaps improve the slide matching accuracy further and do some user testing so that we can include results for that in our final report. We also need to finish up our final report and do some testing tomorrow of the full system before the demo.

Weekly Status Report for 12.02.23

The most significant risks that need to be mitigated is, again, our ML model accuracy, but now also our user testing. Our ML models are still currently not finished, and are not working at the level of accuracy we expected. However, we can mitigate this if absolutely necessary by allowing professors to provide written graph descriptions for each graph in their slide deck, then parsing these descriptions ourselves in order to output accurate descriptions. As for user testing, we want to try to have users test our product the following week, but this might not be viable because our integration is still not done. So, our mitigation plan is to collect data during the demo for our final report.

We changed the design of the system to require the professors to add bolded slide numbers with a red bounding box around them in order to increase the accuracy of our slide matching model, since without it, the slide matching model performed very poorly. We also limited our scope to just be line graphs and scatterplots because we did not have enough data or time to label new data for the other kinds of graphs. This would also increase the time we could spend on these two graphs, and thus produce a more accurate output.

No changes to the schedule.

See Nithya and Jaspreet’s status reports for images of the working slide matching ML model and 3D printed component case.

Aditi’s Status Report for 12.02.23

This week, I completed most of the hardware/software/ML integration. I was able to get the slide description model fully integrated, as well as the “start” button. I also helped gather and label data for the slide matching and graph description models, as well as work on geometrically preprocessing for the slide matching models. I was able to begin the integration for the graph description pipeline, but cannot finish until the graph description model itself is finished.

I am personally ahead of schedule, as my subsystem has been finished, but have taken on more tasks in the past few weeks. Our team is behind schedule, since we should have tested this week. However, we will be able to test once everything is on the Jetson. Next week, I plan to finish integration and begin testing.

Nithya’s Status Report for 12.2.23

There has been a lot of progress on the ML models in the last two weeks.
1.I gathered and annotated 1000 real slides from lectures with graphs to augment the dataset.
2.I trained and evaluated the graph detection model (YOLO) – this was fairly successful, but there are some small issues with the bounding box cutting off axis labels. Here are some example results.
 
3.I labeled 850 images of captured lecture slides, modified Siamese network, and trained it twice (once with class imbalance and the other with balance). This didn’t work so I switched the approach to a combined integer detection and then classification problem.
4.I wrote a script to go through all lecture PDFs and extract slides as images. I wrote another script to place the slide number in a red box in the bottom right corner of the image. There was a lot of iteration required for this in order to produce the best possible image for number detection.
5.I gathered and annotated bounding boxes for 1000 lecture slides with the slide number in the particular format described above. I trained the object detection model YOLO to detect these slide numbers, which was successful. Here are some example results.
6.We tried using image processing methods such as denoising, thresholding, etc followed by tesseract (OCR) to extract the number from the cropped detected bounding box. This was not successful, so I switched to MNIST multi digit detection approach. I implemented a CNN from scratch which would classify each of the detected digits. I gathered and labeled about 600 images to augment the MNIST dataset for slide matching. I wrote a script to extract graphs from the 1000 gathered lecture slides. However the results of this were very poor, so we decided to switch back to the detection and processing approach, except using a simple MNIST classifier instead of OCR. This was fairly successful with an accuracy of 73% on a test set of 110 images from TechSpark. Here are some examples.
7.I wrote a script to generate 5000 each of line and scatter plots as well as reference descriptions.
8.For graph description, I modified the CNN-LSTM code and helped write sample descriptions for the approximately 780 graphs we captured and extracted in TechSpark. Here are the results for a scatterplot:
9.I helped Aditi with integration of slide matching by compiling detection and ML models into the proper format.
We are on schedule – what still needs to be done is improving the slide matching model and simply training and evaluating the graph description model, which will be done tonight and tomorrow. We will continue to make improvements and finish the integration tomorrow.

Jaspreet’s Status Report for 12.2.23

Since the last status report, I have made a lot of progress on the hardware subsystem, and have helped with integration of our subsystems as well as gathered data for our ML models.

Regarding the hardware subsystem, the component case was finally printed and assembled, and is completely finished. Printing the case ended up being a lot more difficult than I thought, as I ran into issues where the print would fail halfway through, someone would stop my print, or the print would be successful, but have minor errors in the design that would require another reprint. Despite these problems, I have now assembled the glasses attachment, which is pictured below.

The camera is positioned on the right face, the buttons are positioned on the top face, and the charging port, the power switch, and other ports are positioned on the left face. As you can see, there is some minor discoloration, but fixing this is not a priority at the moment. If I have extra time next week, I should be able to fix this relatively easily.

Furthermore, I have helped with the integration of the subsystems. Specifically, I added code to the Raspberry Pi so that once the start button is pressed, it will not only send an image to the Jetson, but also receive the extracted description corresponding to that image. It then sends this description to our iOS app, where it is read aloud. Currently though, our code is running locally on our laptops instead of the Jetson, since we are prioritizing making our system functional first.

Finally, I spent many hours working on gathering image data for our ML models, as well as manually annotating our data. For our slide matching model, I used a script I had previously written on the Pi to gather images of slides that have slide numbers in boxes on the bottom right. One such picture is shown below. We were able to gather a couple hundred of these images. For our graph description model, I helped write graph descriptions for a few hundred graphs, including information about their trends and general shape.

My progress is currently behind schedule, since our team’s progress is behind schedule. We are currently supposed to be testing our system with users, but since our system is not complete we cannot do so. I am also supposed to have placed our code on the Jetson, but we cannot do so without finalized code. We will have to spend time as a team finalizing the integration of our subsystem in order to get back on track.

In the next week, I hope to be able to put all necessary code on the Jetson so that the hardware is completely ready. I also will help finalize integration for our project. After that, I will help with user testing, as well as working on final deliverables for our project.

Team Status Report for 11.18.23

I think we have grown as a team in terms of many skills like communication, planning, and time management. Throughout the semester so far, one strategy we have started employing recently is setting regular times to meet outside of class to work on our project, even though what we have to work on is separate and does not necessarily require other teammates to complete. This makes us more accountable and productive and was particularly useful before our interim demo. For joint tasks like data collection, we also set specific goals for how many images we wanted to gather per day, and we were able to stick to that schedule. One final strategy is to ask for help early on – I think that earlier in the semester, when we got stuck on something, we would try for a long time to figure it out on our own, but with the end-of-semester deadlines approaching, we found that it is best to ask for help immediately to resolve any issues.

The most significant risk is still the ML models not working. The ML model we must have working for our final project is the slide detection model, which is necessary to get any sort of output from our app. It must be able to at least identify the slide and output the text on the slide, even if the graph data cannot be extracted. We have been managing this risk by taking a lot of images that we can use to train the model on, and have contingency plans involving taking more images later on if the model is not accurate enough. Similarly, we have a lot of data for the graph data extraction model, but they are all similarly formatted because we decided to auto-generate them through a python script. If need be, we can find another dataset online that contains pre-tagged graph data in order to make the training set more diverse.

Here are some of the sets of pictures that we took in different lecture rooms across campus. We projected sample slides in HH-1107 and WEH-7500 as you can see below, but we also took images in other rooms. Below, we’ve shown what an image of a slide looks like with our camera, and also that we’ve managed to capture many slides from these angles.


We also fixed a bug (regarding the checkered box pattern instead of text) in the random slide generation, allowing for better quality slides to be produced. Here are some examples – we were able to generate 10,000 slides like this.

Jaspreet’s Status Report for 11.18.23

This week, I made progress on the CAD for our hardware component case. It was slightly difficult to import the CAD models for some of the components we bought, but all that’s left is finalizing the case design that surrounds it. I also spent time this week programming our Raspberry Pi so we could use it to gather image data for our slide matching model. We were able to take close to 6000 images that we can train on. Finally, I ordered new cameras with different FOVs and dimensions so that we can compare their performances and effects on our ML models.

My progress is behind schedule. I expected to have a printed component case by the end of the week, but have not been able to do so yet. In order to catch up, I will finish the CAD by Sunday so that we can print out the case as soon as possible. In the next week, I hope to fully complete my subsystem so we can begin testing.

Nithya’s Status Report for 11.18.23

This week, our entire team focused primarily on data collection for the image-slide matching model. We set up 3 different sessions for about 2 hours each in various rooms across campus and compiled a master presentation of almost 5000 unique slides to take images of using our camera. We did this in Wean, Gates, and Hamerschlag classrooms, and the images we took were also varied in terms of lighting, content of the lecture slide in the image, distance to the lecture slide, and angle. See some of these images in the team status report.


I also did some more research into the Siamese Network we will need for the image-slide matching task, particularly the loss function. One method is simple binary cross-entropy loss, where we have a training pair labelled as 1 (if the image is of the lecture slide), or 0 (if the image is different from the lecture slide). Alternatively, we can consider triplet loss. To make this work, one training example will now consist of 3 images: an anchor a (a randomly selected image from the training set – this will be a pure lecture slide), a positive example p (an image from the training set in the same class as the anchor, so an image of the same slide), and a negative example n (an image from the training set that is of a different lecture slide). We then get embeddings for each of these 3 images, and in the loss function, we want to ensure that the distance between the anchor and positive example is less than the distance between the anchor and negative example. To prevent trivial zero-embeddings or the same embeddings for all images, we will require that ||f(a) – f(p)||^2 – ||f(a) – f(n)||^2 <= -alpha, where alpha is some positive constant that we will set as a hyperparameter (note that f is the function performed on the input images by the CNN); it acts as a threshold, specifying that the distance between the anchor and positive example must be at least alpha smaller than the distance between the anchor and negative example. 


Finally, I had to go back and fix a bug from the random slide generation which was causing text to appear as rectangles on the slide. I made a Stack Overflow post to try to get help (https://stackoverflow.com/questions/77467424/getting-checkerboard-output-when-drawing-text-on-pil-image) but I ended up figuring out the problem on my own: the problem was with a specific font that I was randomly selecting, so once I removed that from the list of fonts to choose from, the problem was solved. See the team status report for some images of this.


In terms of schedule, I am a little bit behind but I think with the extra time we have next week, I will definitely be able to catch up; I will be using the extra time Wednesday – Friday to continue working on the image-slide matching model. In terms of deliverables, I hope to complete the image-slide matching model, train it using our gathered image data, and show some results here next week. 

Aditi’s Status Report for 11.18.23

This week, since I had already finished my portion of the project, I gathered data for the slide detection model. I was able to gather about 6000 pictures of slides across 5 locations and multiple angles.

I’m still ahead of schedule. During Thanksgiving break, I plan on emailing the disabilities office to see if there may be any visually-impaired students/faculty who can test our product after we get back from break. The week after will likely just be testing and working on final deliverables, as well as helping my teammates with their subsystems.

Team Status Report for 11.11.23

The most significant risks that could jeopardize the success of the project are primarily related to the ML Model: specifically, not having enough data for the ML model and/or not getting accurate results. We saw poor results this last week when training the graph detection model on a very small number of images, so contingency plans involve having the whole group involved in the data collection process as well as augmenting our data with a large number of auto-generated images, which we have already implemented.

Another risk is not being able to find enough testers/not finding visually-impaired people willing to work with us to test the product. Contingency plans involve testing the product heavily on sighted users, and we are managing the other risk by beginning to reach out to try to find visually-impaired testers.

We did not make any changes to the system design, and did not update our schedule.

We were able to connect up our Raspberry Pi, camera, and buttons as shown below.

We were able to get the graph generation and slide generation working this week. See Nithya’s post for images of this. We also got the stop button and the app to communicate by setting up a server on the app side.

Nithya’s Status Report for 11.11.23

This week, I worked on generating data for and training the graph detection algorithm. At first, I tried gathering data from online and from my own lecture slides, but I was not able to find a sufficient number of images (only about 50 positive examples, whereas a similar detection algorithm for faces required about 120,000 images). I used a tool called Roboflow to label the graph bounding box coordinates and use them for training, but with such few images, the model produced very poor results. For example, here was one image where several small features were identified as graphs with moderately high confidence:


Due to the lack of data and the tediousness of having to manually label the bounding box coordinates of each graph on a particular slide, I decided to generate my own data: slides with graphs on them. To ensure diversity in the data set, my code for generating the data probabilistically selects elements of a presentation such as slide title, slide color, number and position of images, number and position of graphs, text position, amount of text, font style, types of graphs, data on the graphs, category names, graph title and axis labels, gridlines, and scale. This is important because if we used the same template to create each slide, the model might learn to only detect graphs if certain conditions are met. Fortunately, part of the code I wrote to randomly generate these lecture slides – specifically, the part that randomly generates graphs – will be useful for the graph description algorithm as well. Here are some examples of randomly generated graphs:

Of course, the graph generation code will have to be slightly modified for the graph description algorithm (specifically graph and axis titles) so they are meaningful and not just random strings of text; however, this should be sufficient for graph detection. 


Here are some examples of the generated full lecture slides with graphs, images, and text:


Since my code randomly chose the locations for any graphs within the slides, I easily modified the code to store these in the text file to be used as the labeled bounding box coordinates for graphs in each image. 

With this, I am able to randomly generate over 100,000 images of slides with graphs, and I will train and be able to show my results on Monday. 


In addition to this, I looked into how Siamese Networks are trained, which will be useful for the slide-to-image matching. I watched the following video series to learn more about few-shot learning and Siamese Networks:

Few-Shot Learning (1/3)

Few-Shot Learning (2/3)

Few-Shot Learning (3/3)


I have not run many tests on the ML side yet, but I am planning to run ablation tests by varying parameters in the graph detection model, and measuring the accuracy of bounding box detection (using the loss function based on intersection over union metric) on a generated validation data set. We will also be testing the graph detection on a much smaller set of slides from our own classes, and we can provide accuracy metrics in terms of IoU for those as well. We can then compare these accuracies to those laid out in our design and use-case requirements. Similarly, for the matching algorithm, measuring accuracy is just a matter of counting up how many images were correctly vs. incorrectly matched; we will just have to separate the data we gather into training, validation, and testing sets. 


My progress is almost on schedule again, but we still need to collect a lot of images for the image-slide matching, and I plan to work on this with my group next week. By next week (actually earlier, since I have completed all but the actual training), I will have the graph detection model fully completed and hopefully some results from the graph description model as well, since we are aiming to gather as many images as we can this week for that model and generate reference descriptions. 


Jaspreet’s Status Report for 11.11.23

This week, I finished implementing the hardware pipeline for sending images from our Raspberry Pi to our Jetson. There were several steps that I went through in order to finish this up. First, I made it so that the Jetson runs a Flask server on startup, so that it can receive the images from the Raspberry Pi through a POST request. I then made it so that the Raspberry Pi camera capture is also run on startup, so that the start button can be pressed to send an image. I also worked with Aditi to set up the stop button, so that any audio description playing from the iOS app is stopped as soon as the button is pressed. I tried to play with the camera settings of the RPi, but will need to further adjust them in order to capture satisfactory images.

My progress is now on schedule, now that we have adjusted our schedule to account for our current level of progress. Despite being on track, there is still plenty of work to be done. The first and most important part for completing our project is to design and print our component case that will attach to the user’s glasses. This must be completed within the next week according to our schedule. If I complete this faster than expected, I will work on decreasing the latency from when the start button is pressed and when the Jetson receives a new image. When designing, we expected that this latency would be much smaller than it currently is, so I will find ways to decrease it.

According to our schedule, in two weeks I will be running the following tests on the hardware system:

  1. I will measure the latency between when the start button is pressed and when the Jetson receives a new image. This is one of the components of the total latency from when the start button is pressed and when the user receives audio description. The hardware component of the latency was estimated to be about 600 ms, but I did not properly account for the amount of time it would take to actually take an image. However, I do not see this being a large issue as we allowed for multiple seconds of leeway in our use case latency requirement.
  2. I will measure the total size weight of the device. In our requirements, we stated that it had to be at most 25mm x 35mm x 100mm in dimension, and at most 60g in weight.
  3. I will measure the battery life and power of the device. We stated that the device should be usable for at least 6 hours at a time before needing to be recharged.

Aditi’s Status Report for 11.11.23

This week, I was able to integrate the hardware and the software by creating a server on my app-side. This server would wait for a STOP signal from the stop button, then would instantly stop the audio. I was having problems with the audio not playing earlier, but I was able to update my XCode version and have it work as normal. Now, every part of my app is fully working, except the API key functionality. That will not take much time, but I don’t want to add it unless I’m sure that it’s absolutely necessary — I am not totally sure if every professor needs to send their API key, or whether just one will suffice. This week, I plan to have my teammates create test Canvas classes with their own accounts in order to see if that matters, then either add or remove that functionality.

I am very on track with my progress, I am almost completely done, and am just waiting on integration from the ML side. Next week, I plan to help Nithya collect data for the ML model and do anything else my teammates need, since my subsystem is basically done.

These are the tests I’m planning on running:
1. Have a visually-impaired person test the app for compatibility with VoiceOver. I will give them my phone, and have them navigate the app and ask for feedback about where it can be improved to make it more accessible.
2. Have a visually-impaired person rate the usefulness of the device, and the outputs from the ML model by allowing them to use the app in conjunction with a pre-prepared slideshow, and compare these values with what we said in our use-case requirements (>90% “useful”)
3. Have sighted volunteers rate the usefulness of the device, and rate the graph description model, and compare with what we said in use-case requirements (>95% useful). If they feel like we are excluding too much of the graph information, we will refine the ML model and gather and train with more data.
4. Test the latency of button press to the start/stop of sound, and compare with what we said in our use case requirements (<100ms)
5. Test the accuracy of our ML model by comparing it to the test set error, as we said in use case requirements (>95% accurate).

Team Status Report for 11.04.23

One major risk is that we will not be able to find an appropriate group of testers for our device. If we do not have enough testers, we won’t be able to gather enough quantitative data to indicate whether or not the various aspects of our design worked as intended. In order to tell whether or not we were successful in creating the device we proposed, we need to be able to compare our requirements to enough quantitative results. In order to manage this, we would need to reach out to our contacts and confirm that we can test our product with visually impaired volunteers. If we are unable to do this, we would instead have to settle for testing with volunteers who aren’t visually impaired. Although they would still be able to provide useful feedback, it would not be ideal. Therefore, we should prioritize managing this risk in the coming week.

Another risk is gathering enough data for the graph description model. We found out after looking into our previous Kaggle dataset in more detail that many of the graph and axis titles are in a Slavic language and so will not be helpful for our English graph description model. To manage these risks, we plan to devote the next couple of days to searching for and gathering new graph data; our contingency plan, as mentioned in a previous status report, is to generate our own data, which we will then create reference descriptions for.

We have adjusted our schedule based on the weeks that we have left in the semester. We plan to finish our device within the next three weeks to leave enough time for testing and preparing our final deliverables.

The following is a test image of a presentation slide displayed on a laptop that was taken from the Raspberry Pi after pressing the “start” button. We can see that the camera brightness may need adjusting, but that it is functional.

For pictures related to progress made on the app this week, see Aditi’s status report.

Nithya’s Status Report for 11.04.23

This week, I finished up the tutorial of the image-captioning model using the Flickr8k dataset. I decided not to train it so as to save my GPU quota for training our actual graph-description and graph identification models. 

I also looked more in depth into how image labels should be formatted. If we use a tokenizer (such as the one from keras.preprocessing.text), we can simply store all of the descriptions in the following format:


1000268201_693b08cb0e.jpg#0 A child in a pink dress is climbing up a set of stairs in an entry way .

1000268201_693b08cb0e.jpg#1 A girl going into a wooden building .

1000268201_693b08cb0e.jpg#2 A little girl climbing into a wooden playhouse .

1000268201_693b08cb0e.jpg#3 A little girl climbing the stairs to her playhouse .


Another thought I had about reference descriptions was whether it would be better to have all reference descriptions follow the same format, or have varied sentence structure. Since the standard image captioning problem typically requires captioning a more diverse set of images (as compared to our graph description problem), there is not much guidance on tasks similar to this. Inferring from image captioning, I think that a simpler/less complex dataset would benefit from a consistent format, and this also addresses the need for precise, unambiguous descriptions (as opposed to descriptions that would be more “creative”). This is why I think we should do an ablation study where we have maybe 3 captions per each image that will differ, and then either 1) follow the same format for all images, or 2) follow a different format for each image. Here is an example of the difference on one of the images:

Ablation Case 1:

This is a bar graph. The x-axis displays the type of graph, and the y-axis displays the count for training and test data. The highest count is just_image, and the lowest count is growth_chart. 


Ablation Case 2:

This bar graph illustrates the counts of training and test graphs over a variety of different graphs, including just_image, bar_chart, and diagram. 


As you can see, the second case has more variation. We might want to have a balanced approach since we have multiple reference descriptions per image, so some of them can always have the same format, and others can have variation. 


Unfortunately, it looks like the previous Kaggle dataset we found includes graph and axis titles in a non-English language, so we will have to find some new data for that.


Additionally, I looked into the algorithm which will detect bounding boxes around the specific types of graphs we are interested in from a slide. I wrote some code which should be able to do this – the main architecture includes a backbone, a neck, and a head. The backbone consists of the primary CNN, which will be something like ResNet-50, and will give us feature maps. Then we can build a FPN (feature pyramid network) for the neck, which will essentially sample layers from the backbone, as well as perform upsampling. Finally, we will have 2 heads – a classification head and a regression head. 


The first head will perform classification (is this a graph or not a graph?) and the second head will perform regression to identify the 4 coordinates of the bounding box. There is also code for anchor boxes and non-max suppression (which eliminates anchor boxes with a high enough IoU, so that we are not identifying 2 bounding boxes for the same object).


Here is some of the code I worked on.


My progress is almost caught up as I got through the tutorial, but I do still need to find new graph data, generate reference descriptions with my teammates, and train the CNN-LSTM. However, I also started working on the graph detection algorithm above ahead of schedule. My plan for the next week is to work on data collection as much as possible (ideally every day with my teammates) so that I can begin training the CNN-LSTM as soon as possible. 

Jaspreet’s Status Report for 11.04.23

This week, I continued to make progress on the pipeline for sending images to the Jetson from our Raspberry Pi. Now, the system is capable of saving an image after the start button is pressed, and it can take input from the stop button as well. However, the button setup is currently on a breadboard just so that it is ready for the demo this week. In the final setup, it should fit compactly within the component case. Once I have set up our HTTP server on the Jetson, we will be able to transfer the captured image via POST request.

My progress is behind schedule. I did not realize that both the Raspberry Pi and NVIDIA Jetson Orin Nano would require so many external components in order to operate. Specifically, I had to obtain microSD cards as well as various cables for display or input purposes. I also had more trouble setting up the WiFi connections than I had anticipated, and in hindsight, I should have reached out for help as soon as I started encountering issues. In order to catch up, I will need to speed up the process for designing and printing all of our 3D printed parts.

In the next week, I will first finish preparations for the interim demo, which include setting up the HTTP server on the Jetson and connecting both the Raspberry Pi and Jetson to campus WiFi. After the demo, I will finally begin designing our hardware component case as well as the textured button caps. This will put me back on track for completing the hardware subsystem on time.

Aditi’s Status Report for 11.04.23

This week, I worked mostly on creating the settings functionality, as well as allowing users to add as many classes as they wanted in a semester. When they enter a new semester, they must re-update these fields. It was difficult to figure out how to allow data to persist across sessions, and the Swift tutorials I followed weren’t working. My solution was just to create a JSON saved to the user’s phone file system, and have all of the information update that JSON.

This is the settings screen:

When you click on New Semester, the user can enter in the corresponding info:

Here is the UI, which uses a mix of high contrast, accessible colors:

When “class 2” is clicked, this is the retrieved result, which is the first slide of the most recently uploaded pdf under the “lectures” module. Currently, it’s printed to the XCode terminal:

Here is the Canvas account I created, with the three test courses:

Here is the userData struct, which is saved to the user’s phone files:

name is the name of the class, and classID is the id of the Canvas course, which is viewable in the Canvas link for the course. The URL for Class 1 is https://canvas.instructure.com/courses/7935642, and the corresponding classID is 793562. The functionality for the user setting an API key will be done later, and must be present across app sessions as well.

When the user saves the settings, and clicks on the button, the first slide will be outputted and read out loud. When we finish the ML model and are able to receive communication from the Jetson, we’ll change it so that the output will be whatever slide the professor is on.

Next week, I plan on helping Nithya and Jaspreet integrate with my Flask server, and reach out to start finding visually-impaired volunteers to test our product. I am still ahead of schedule, and am almost completely finished with my subsystem.

Jaspreet’s Status Report for 10.28.23

This week I continued working on implementing the image to server pipeline using our Raspberry Pi Zero and Unistorm camera. I realized that the OS I had configured on the SD card was not properly compatible, so I went back and redownloaded Raspberry Pi OS. I then reconfigured the Pi so that I could use ssh to access it and use VNC viewer. I still have to finish setting up the GPIO button input and sending an image from the camera to an external server.

I ended up having to spend time completing work for other classes, and was not able to complete the goals I set for this week. I plan to spend most of Sunday completing my tasks for this week so that I can stay on schedule. Then, next week, I will begin creating a CAD of our 3d printed component case.

Nithya’s Status Report for 10.28.23

This week, I continued to work through the CNN-LSTM tutorial from last week and specifically tried to address the issue I faced last week with training. Training such large models requires GPU, and resources like Google Colab provide only a limited number of hours using the GPU for free. Since another one of my classes has assigned us many AWS credits and I am likely to have some extra, I looked into training this tutorial model (and eventually our CNN-LSTM model) on AWS. Since I was totally new to AWS, I worked through this presentation to get set up:

AWS

I learned about different Amazon Machine Images (AMIs) as well as EC2 instance types. I faced some issues launching these instances and I discovered this was because of my vCPU limits. It took several days for my limit increase request to be approved, and then I was able to launch the instance.


I also learned about persistent storage, EFS in particular. This is important because when an instance is stopped, the file storage for that instance will be deleted (and unfortunately I experienced that when I had to stop my instance and restart it). I am still having some issues working out how to set up EFS and this is something that will definitely need to be fixed before we start training our model, in order to minimize the time we need to spend paying for active instances.


My progress is still behind as I wanted to work on the graph description model this week but was still caught up with the tutorial. I did work on the tutorial several days this week but due to the delay in getting my vCPU limit increased, I did not have much time to work through the subsequent issues with EFS. For next week, I will again try to work on the tutorial and graph description model several days, and I am currently (and will continue to) look into ways to solve the EFS issue to ensure smooth training when our model is ready.


For next week, I would like to have the results of the tutorial and a draft architecture for the CNN-LSTM. I also hope to work out how to do all of the labeling/figure out how the reference captions and images should be formatted so that they can be easily fed to the model.

Team Status Report for 10.28.23

The main risk we saw this week was the weight of the camera attachment being too heavy. We felt like it was much heavier than we expected the attachment to be, but we feel like it still does not pose a major welfare risk to the user as it stands. However, we will need to make additional weight calculations once we attach the component box, and the buttons to the hardware subsystem. If these additional components are too heavy, we will look into getting different buttons, or perhaps even attaching some components outside of the glasses attachment – perhaps use some handheld buttons instead of having them on the glasses. However, the risk is currently being managed by choosing low density materials for the rest of the components, specifically the component box.

A smaller risk continues to be the accuracy of the ML model. We have started looking more into the graph description models, and will change the type of model and the amount of data we train it with in order to mitigate these risks. We have been choosing the specific type of model to manage risks preemptively, because some ML models require much more data than we have the capacity for.

We are currently in the process of implementing our design, and have not made any changes to the design of the system, and no schedule changes have occurred.

The JSON shows that we have been able to go through the Canvas security handshake and receive a response about the location of the file we are extracting.

We were also able to create test instructor Canvas courses.

Aditi’s Status Report for 10.28.23

This week, I worked on the Canvas scraping software, and finished it completely. It was pretty difficult to figure out everything about using the API, so this is the work I did for the bulk of the week. First, I had to create a new Canvas instructor account in order to create new test classes, and then I had to get the API key associated with the account. Then, I had to perform the following steps in the code:

1. Make a request to Canvas for the most recent file under the “Lectures” module, if such a module exists. I sent Canvas my API token and authorization key in the header for the security handshake.

2. Canvas sent me a JSON file of metadata about the most recent file. This was the most confusing part of the API — with no warning, when making a request for a specific file, the API will send back the JSON of metadata rather than the file itself, but the name of the JSON will be exactly identical to the name of the file.

3. Within this JSON, there is a value called “html_url,” which is the actual location of the file we need to extract. So, we must make another request to that url in order to retrieve the file.

Next week, I plan on modifying the app to make a settings screen, where they can set the classes they are taking, and the class code associated with each one, which also means I need to add functionality to support extracting information from multiple classes. I also plan to refine the UI to make it more accessible using the WCAG 2 guidelines.

I am still ahead of schedule, and am on track to finishing the app within the next couple of weeks. The final thing I need to do after next week will be integrating the button press/camera with the Flask server, and my subsystem will be complete.

Jaspreet’s Status Report for 10.21.23

This week, we received the hardware components that we ordered, and I will be able to begin work on testing and assembling them once we are back from Fall Break. While waiting for the components, I was able to test out capturing and sending images from the Raspberry Pi 4 and Arducam camera module that we borrowed. This will make it much easier to set up the same pipeline with the Raspberry Pi Zero and Unistorm camera module. The majority of the rest of the week was spent working on our design report, which took much longer than we expected.

My planned tasks for the near future are to set up an image to server data pipeline and create a 3d printed case for our hardware components. In order to accomplish my planned tasks, I will have to look into how to capture an image with the Raspberry Pi based on a button press input, and how to then send an image to a remote web server. For the case, I will have to look into how to create a functional 3d model in CAD software. I will also have to look into different methods of attaching our device to the side of glasses.

My progress is not on schedule, as we had planned to receive our components earlier in the week. However, when I submitted our order forms, I forgot to check it off with our group’s TA, so our order was delayed. Therefore, according to our schedule I will need to set up the image to server pipeline and test data transfer from our camera by the end of the week to catch up. In the next week, I hope to do this as well as set up a server on the Jetson so that we can test sending our images to it. Since I am behind schedule, it will be necessary to spend extra time to finish these tasks by the end of the week.

Team Status Report for 10.21.23

One risk that we will have to consider is that our device’s attachment mechanism will not be sufficient or easy enough to use. When looking into how we could create a universal attachment for all types of glasses, we narrowed down our options to using either a hooking mechanism or a magnetic mechanism. With a hooking mechanism, we risk that our users may not be able to easily clasp our device on, and with a magnetic mechanism we risk that our device may not be secure enough. To manage the risk with a hooking mechanism, we can iterate over multiple designs and receive user feedback for which is easiest to use. For the magnetic mechanism, we can try to increase the strength of the magnet so that the attachment is more secure. However, it is worth noting that in the worst case scenario, if neither of these solutions work, the image capturing and audio description functionality of our device will still be testable.

Another risk to consider is the latency of the graph description model; after doing some more research into how exactly the CNN-LSTM model works (see Nithya’s status report), we discovered that the generation of the graph description may take longer than we originally anticipated. Specifically, the sequence processor portion of the model needs to generate the output sequence one word at a time, and the way that a particular word is generated is by performing a softmax over the entire vocabulary and then choosing the highest-probability output. This is discussed more in the “changes” section below, but we can manage this risk by (1) further limiting/decreasing the length of the output description, and (2) modifying our use case and design requirements to accommodate for this change.

The biggest change we made was adding the new functionality of the Canvas scraping software. We figured that it might be unnecessary, annoying, and difficult for the visually-impaired user to have to download the PDF of the lecture from Canvas, email it to themselves to get it on their iPhone, then upload it to the iOS app in order for our ML model to parse it before the lecture. We felt like it also might take too much time and discourage people from using our project, especially if they have lots of back to back classes with short passing periods. So, we decided to add the functionality where the user could simply click a button on the app, and have the Flask server automatically scrape the most recent lecture PDF depending on which button the user clicks. This incurs the following costs:

  1. We need to add an extra week to Aditi’s portion of the schedule to allow her to make the change.
  2. Professors must be willing to provide their visually-impaired students with an API key that they will put into the app so that the application will have access to the lectures in the Canvas course.
  3. The visually-impaired user will have to ask their professor for this API key.

To address cost (1), Aditi is already ahead of schedule, and this added functionality will not put her behind. However, if it does, one of the other team members can help take on some of the load. To mitigate (2), we will provide a disclaimer from the app to explain to the professors that the app will only scrape materials that are already available for the user to see, so there will not be a privacy concern. The app will only scrape the most recent lecture under the “Lectures” module, so unpublished files will not be extracted. We felt like it was not necessary to mitigate (3), because asking for an API key will still likely be faster and less time consuming than having to download and upload the new lecture PDF before every class.

Another change is the graph description model latency which was mentioned above. We will need to change the design requirements to be slightly more relaxed for this specific portion of the before-class latency, which we set at 10 seconds. We still don’t have a specific estimate for how long the CNN-LSTM model will actually take given some input graph, but we may need to increase this time bound; however, this should not be a problem as we have a lot of wiggle room. In our use-case requirements, we stated that the student should upload the slides 10 minutes before class, so the total latency before class need only be under 10 minutes, and we are confident that we will be able to process the slides in less than this amount of time.

We have adjusted our schedule based on the changes listed above, and have highlighted the schedule changes in red.


Nithya’s Status Report for 10.21.23

This week, I dove deeper into understanding the CNN-LSTM model and got started working with some code for one implementation of this kind of network for image captioning. I worked through the tutorial on this site:


How to Develop a Deep Learning Caption Generation Model

This tutorial uses images from the Flickr8k dataset. The CNN-LSTM model has 2 parts: the first is a feature extractor, and the second is the sequence model which generates the output description of the image. One important thing that I learned this week while working through this tutorial is about how the sequence model works: it generates the output sequence one word at a time by using a softmax over all words in the vocabulary, and this requires an “input sequence”, which is actually the sequence of previously generated words. Of course, we can upper-bound the length of the total output sequence (the example used 34 words as the bound).


Since the sequence model requires a “previously generated” sequence as input, we also make use of <startseq> and <endseq> tokens. Here is the example given in the article of how the CNN-LSTM would generate the description for an image of a girl:

Here is a portion of the full code, which encodes the architecture of the CNN-LSTM model, as well as a diagram which is provided in the article which helped me to better understand the layers in the model. I need to do a little more research into how the feature extractor and the sequence processor are combined (the last few layers where the two branches join) using a decoder, as I didn’t fully understand the purpose of this when I read this article. This is one of the things I will be looking into next week.


I wasn’t able to train the model and test any sample images this week (the model has to train for a while and given the number of images, it would take a lot of GPU power, and my quota for this week has been exhausted) – however, this is something else I hope to do next week.


I am a little behind schedule as I was hoping to have a more comprehensive grasp of the CNN-LSTM as well as have tried out the standard version of the model (without the necessary tweaks for our use case) by this time; however, I am confident that I will be able to catch up next week, as next week is also devoted to working on the graph description model. In terms of actions I will take, I will make sure to work on the graph description model both during class-time as well as on Tuesday and Thursday to catch up.


For next week, I hope to have the test version of CNN-LSTM for image captioning fully working with some results on sample images from the Flickr8k dataset, as well as determine how to do the labelling for our gathered/generated graph data.


Aditi’s Status Report for 10.21.23

This week I mocked up a finalized design for the iOS app. Since we added the functionality for students to automatically scrape the lectures from Canvas (instead of having to download the PDF themselves, email it to their phone, then upload it to the app), I had to change the design. Here is what it might look like, for a student taking the corresponding 4 lecture classes:

I also had to modify the Swift and Flask server code to allow for the following functionality in the test app: When I click one of the buttons in the iPhone simulator, the Flask server should send the app a PDF corresponding to that lecture. Previously, I only had one button corresponding to one lecture, but I had to modify it to send multiple. I also looked into the Canvas scraping code, but I plan on implementing that next week.

I also spoke with Catherine from Disability Resources, who said that I should be looking into the Web Content Accessibility Guidelines (WCAG), and look into preexisting work on data accessibility. She also thought that we might want to add a feature to let the user know when the slide has changed. I will look into all of this next week.

The other main task I completed before break was working on the design report, which took a lot more time than all of us expected. However, we were able to turn out a good finished product.

I was ahead of schedule for the past couple of weeks, but now I am exactly on schedule. Because I was ahead of schedule, I decided to take on the task of building the Canvas scraper, which I plan to finish next week, along with the integration of the scraper with my Flask server.

The individual question states: What new tools are you looking into learning so you are able to accomplish your planned tasks? I plan on learning more about how to use the Canvas API, since I have never used one before. I need to figure out what headers to send to authenticate the user, and what it will send me back, and how to parse that information. I need to look at some prebuilt Canvas scraping code, which I found here: https://github.com/Gigahawk/canvas-file-scraper/blob/master/README.md and figure out how to adapt it to my use case. I also likely will end up helping Jaspreet with integrating the RaspberryPI with the Flask server, and I have never worked with sending image data from the RPi before so I need to find out how to do that.

Team Status Report for 10.07.23

Our team used several principles of engineering, science, and math to develop the design solution for our project.

  1. Engineering Principle: one engineering principle we considered while developing our design was sustainability. We chose components and emphasized through our use case requirements that the device’s power consumption should not be too high and the app’s power consumption on the user’s phone should also be limited. 
  2. Scientific Principle: one scientific principle we used was peer review – one of the major changes we made to our design was based on the feedback we got from our proposal presentation, regarding having the slides pre-uploaded to the app. Peer review is an extremely important part of the design process since it allows for improvement in iterations. 
  3. Math Principle: one math principle we considered was precision, and this informed our decision for which models to select, as well as the change we made to our original idea of using Tesseract directly during the lecture, to now perform text extraction from the pre-uploaded slides. 

One major risk is the ML model not being finished in time. However, this risk is being managed by simply working on gathering data as soon as possible, which we also mentioned in last week’s status reports. Our contingency plans include using more data that is readily available on the internet, rather than relying on tagging and collecting our own data.

No major changes were made to the design. However, based on the feedback from the design presentation, we plan on thinking more about the design requirements and fleshing these out for the upcoming design report deliverable. We also had questions about why the glasses were necessary, and whether the audio from the device would be too distracting during class. We thought about this feedback, and we decided not to move forward with any changes — we plan on addressing why these concerns were not extremely pressing, and why we think our product will not fall victim to these issues in the actual design report.

See Aditi’s status report for some progress photos on the app simulation!

Nithya’s Status Report for 10.07.23

This week, I mainly worked on looking into data sources for training the graph description model. Of course, we will need a significant number of images of bar graphs, line graphs, scatterplots, and pie charts for training the graph description algorithm, even though we are planning to use pre-trained weights for the CNN-LSTM model. 


For a dataset, here is one Kaggle dataset that contains 16,000 images of graphs, separated into 8 classes – this includes bar charts and pie charts, both of which we need for our use case. It was difficult finding a source which contained scatter plots and line graphs. One alternative to trying to find a single source containing a collection of graphs is web scraping, using Beautiful Soup. Essentially, if we have a list of websites, we can write a Python script as described here (https://www.geeksforgeeks.org/image-scraping-with-python/) to extract any images from that site. We would have to manually get these URLs and also filter out any non-graph images that are found this way, but it is another way we can gather data. 


I also looked into some methods for increasing the number of images in our training set – some of these augmentation techniques are randomly cropping the image, flipping the image horizontally, changing the colors in the image, etc. Many of these, like the random crop and flipping the image, unfortunately may not be well-suited for graphs even though they are common augmentation techniques for CV tasks in general.  


Another idea I had was to have some Python program generate graphs for us. This would be particularly useful for line and scatterplots, where a lot of the data on the x and y axes could be randomly generated using numpy. For this idea, we could also come up with a large list of axis labels so that what the graph is plotting wouldn’t be the same for all of the computer-generated graphs. Overall, I think this idea would allow us to generate a lot of varied graphs in a small amount of time, and would be a good addition to the data that we are able to gather online. 


Here’s an example of what the random graph generation code would look like, as well as the resulting graph (these would be supplemented with axis labels and a title of course):


My progress is on schedule, as my goal for this week was to look into some graph data sources. For next week, my goal is to get started on understanding the code for the CNN-LSTM model, making changes to the architecture, and potentially begin training on the images of the Kaggle dataset.

Jaspreet’s Status Report for 10.07.23

This week, I ordered the hardware components that we plan on using for our project. This includes the Raspberry Pi Zero, camera, battery, and Nvidia Jetson. One issue I ran into while ordering parts was that the original camera that I selected was out of stock in many stores, and would take multiple weeks to arrive in others. Therefore, I ordered the backup camera instead, which is the Unistorm Raspberry Pi Zero W Camera. This camera has the same resolution and FOV, and is a very similar size, so I feel comfortable ordering it as a replacement. I also ordered an Nvidia Jetson Orin Nano Dev Kit from ECE inventory, which we plan on using to host our server with our ML models. Finally, I spent some time working with a Raspberry Pi 4 and Arducam module to test how to send an image wirelessly from the Pi. I plan on making more progress on this throughout the coming week.

I am slightly behind schedule, as even though I have ordered all of the hardware components, I have not looked into how to give the buttons texture so that they can be easily differentiated. However, I don’t expect this to take too much time, and I should be able to figure out the solution this weekend. For the next week, while I wait for components I hope to continue testing out how to send images wirelessly with a Raspberry Pi 4 and compatible camera. However, I don’t expect this to take up a lot of time, so I plan on helping my group members with their work. Specifically, I plan on helping gather image data for training our ML models, and I will get more information on what data to gather from Nithya.

Aditi’s Status Report for 10.07.23

This week, I created an app on XCode that can perform the following functions: allow users to upload a PDF file, send this PDF to a Flask server, receive the extracted text from the server, and speak this text out loud. I also built the associated Flask server in Python. On the server, there is some python code to extract only the information on a single slide — only one slide needs to be spoken aloud at a time. For the final app, the actual screen description won’t be printed (this is just for testing).

Here are images of the working code on an iPhone 14 Pro simulator:


One issue I ran into was not being able to test out the haptics and accessibility measures I implemented, as well as the text to speech. This cannot be tested on a simulator, and to feel the physical vibrations from the haptics, I needed to test it on my personal phone. However, I need an Apple Developer account in order to test anything on my personal phone (rather than a built-in simulator). So, I emailed professors and faculty who know about iOS development (like Prof. Larry Heimann who teaches an iOS dev course at CMU), and am waiting on a response from them. However, for the most part, the application seems to be finished and working for the time being. The major additions I will have to make is implementing logic on the python code running on the Flask server, but this will be done after the ML model is completed.

I am still ahead of schedule, but I expected to get some work done with respect to gathering training data for the ML model. However, I was unable to do that since the bugs I had in my Swift code took a long time to debug.

Next week, I will primarily focus on gathering a large portion of the data we need to train the slide and graph recognition models, as well as spend a lot of time working on my design presentation.


Jaspreet’s Status Report for 09.30.23

This week, I selected the necessary hardware components for our design, including the camera, battery, and computing device.

Computing Device: Raspberry Pi Zero WH. Our computing device needed to be able to send image data wirelessly to our server at the press of a button. It also needed to be small and lightweight so that it could fit comfortably to glasses. The Raspberry Pi Zero WH fulfills all these roles, as the W indicates that it is compatible with WiFi, and the H indicates that it has GPIO headers which can be connected to our buttons. It has dimensions of 65 mm x 30 mm x 10 mm and weighs 11 g, which is small enough for our purposes. Another plus is that it has a built in CSI camera connector, which we can take advantage of.

Camera: Arducam 5MP OV5647 Miniature Camera Model for Pi Zero. Since we are using a Raspberry Pi Zero, it makes sense to use a camera made exactly for that board. Therefore, I chose the Arducam Miniature Camera Model. The camera itself is about 6mm x 6mm, and is attached to a 60 mm flex cable that in total weighs about 2 g, which is small compared to other camera modules.

Battery: PiSugar 2 Power Module. After searching for rechargeable lithium batteries for the Raspberry Pi Zero, I came across the PiSugar 2. This is a custom board and battery made specifically for the Pi Zero, which makes it easier to power the Pi. This weighs about 25 g, which is a lot, but most batteries that provide enough power for our use case requirements weigh about this much.

Buttons: Any medium sized push buttons will work for our use case. I need to look more into how I can texture these buttons to make it easier for a blind user to differentiate between the start and stop buttons.

The useful courses that helped me throughout this week include 18-441 Computer Networks and 18-349 Intro to Embedded Systems. In these courses I learned about sending data over wireless connections as well as using GPIO pins to read inputs from buttons.

My progress is now on schedule. In the next week I hope to order all necessary components, and begin working on the pipeline for sending an image from our camera through a Pi. I have acquired a Raspberry Pi 4 and a compatible camera that I can test on and use to gain insight into the work I will need to do once we receive our components.

Team Status Report for 09.30.23

One risk to take into account with the changed system design is the method of matching images taken from the camera with slides from the deck, particularly in edge cases such as animations on the slides where only part of the content is shown when the image is captured, or annotations on the slides (highlight, circles, underlines, drawing, etc.). Our contingency plan to mitigate this risk is having multiple different matching methods ready to try – we have the text extraction method which we will try first, as well as another CNN structure similar to how facial recognition works. In facial recognition, there is a “database” of known faces and an image of a new face that we want to recognize is first put through a CNN to get a face embedding. This embedding can then be compared to those of other people in the database and the most similar one is returned as the best match. 


Another risk/challenge may be generating the graph descriptions so that they are descriptive yet concise; the success of the graph descriptions will depend on the reference descriptions that we provide, so our contingency plan is to each provide a description for each image we use during the training process so that we get less biased results (since each reference description will be weighted equally when calculating loss). 


We made two main modifications to our project this week.

1.  We added a graph description feature on top of our text extraction feature. This was mostly meant to add complexity, as well as help provide users with more information. This requires another separate ML model that we have to collect data for, train, and implement. This incurs the cost of increasing the amount of time it will take for us to collect data, since we were only previously expecting to collect data for slide recognition. However, we plan on mitigating these costs by finding a large chunk of the data online, as well as starting to create our own data as soon as possible, so we can get started early. This also feeds into our next modification, which is meant to help ease the burden of manufacturing our own data.

2.  We modified our product to include a feature where the user should upload the slides to the app which their professor has made available before the lecture. Then, when the user takes a picture with our camera during class, our app will just compare the text on the picture the user has taken with the text on the pre-uploaded slides, and recognize which slide the professor is currently on. This is important because our product will extract both text and graph data with much better accuracy since we would be working directly off of the original formatted slides, rather than a potentially blurry and skewed image that the user would take with our fairly low resolution camera. This also decreases the latency, because now all of the text and graph descriptions can be extracted before the lecture even begins, so the only latency during the lecture will be related to determining which slide the user is on, and the text to speech — both of which should be fairly quick operations. This modification also allows us to scrape lots of the training data for our ML model from online: previously we would have to collect data of blurry or angled photographs of slides, but now that we’re working directly off of the original slides and graphs, we would only need pictures of the slides and graphs themselves, which should be easy to find ourselves (and create if needed). This does incur the extra cost of the user having to upload the slides beforehand, which raises accessibility concerns. However, we plan on including haptics and accessibility functions to the app that would make this very easy. It also incurs the cost of the professor having to upload the slides beforehand, but this is usually done regardless of our product’s existence, so we don’t think this is too big of a concern.


Here is our updated schedule, which is also included in the Design Presentation:


Here are some progress photos from this week:

Slide bounding box recognition:

Slide pre-processing:

ML Data Tagging Tool:

Nithya’s Status Report for 09.30.23


This week, I set up PyTesseract on my computer and was able to test it with a few images. Getting the tesseract module on my M1 Mac was a little challenging since certain packages are not compatible with the M1 chip (as opposed to the standard Intel chip). After getting that working, I tried running tesseract with a somewhat low quality image of my student ID card, and the results from that were fairly good, although certain parts were misidentified or left out. For example, my student ID number was correctly identified, but “Carnegie Mellon University” was read as “patnecie Mellon University”. Given that we will mainly be performing text recognition on very high quality images with our new change of pre-uploading slides, I don’t think the accuracy of PyTesseract will pose a large problem for us.  This is the code I used for testing tesseract:


I learned from visiting this site (https://tesseract-ocr.github.io/tessdoc/Data-Files-in-different-versions.html) that tesseract already has support for identifying math symbols and equations. I hope to test this out more thoroughly next week, but preliminary results from this week seemed promising (identifying numbers and symbols like = correctly). 


Since we decided to extend our use case by identifying and generating descriptions for certain types of graphs, I did a lot of research on how this would work. Initially, I looked at a few papers on the topic of “scene understanding” and “scene graph generation”, which is a similar problem to the one we are trying to solve; this involves building relationships between objects identified in images in the form of a graph. 


I went on to look at papers on the topic of image description/captioning, which I feel is the most relevant to our graph description problem. From this paper (https://aclanthology.org/P19-1654.pdf), which actually proposes a new metric for measuring how accurate descriptions of images are, I learned that there are 2 standard methods of evaluating image descriptions/captions. The first is by human judgment – ask a person to rate the overall quality of a description and also rate based on certain criteria (relevance fluency, etc.). The second is automatic metrics, which compare the candidate description to a human-authored reference description. This is typically done by Word Mover’s Distance, which measures the distance between two documents in a word embedding space. We will use the same metric for our graph descriptions. 


Courses which covered the engineering, science, and math principles our team used to develop our design include 18-240, 16-385 (Computer Vision), 18-290, 18-491 (Digital Signal Processing), 11-411 (Natural Language Processing), and 18-794 (Intro to Deep Learning & Pattern Recognition for Computer Vision). The last course in particular has already helped me a lot in understanding the different types of computer vision tasks we need to solve and the appropriate algorithms for them.


My progress is on schedule as this week, my main goal was to get PyTesseract working locally and start testing it out. Since we also made some changes to the use case, I updated my tasks in the schedule to focus more on the graph description model. 


For the next week, I want to do more research into and maybe begin implementing the first version of the matching algorithm (for matching images of slides to pre-uploaded slides). I will also begin collecting and labeling graph data with my teammates.

Aditi’s Status Report for 09.30.23

This week I worked mainly on the pre-processing of potential slide image data, as well as the post-processing of possible text outputs.

First, I took an image on my phone of my computer screen with a sample slide on it:

For the pre-processing, I first figured out how to de-skew the image and crop it so the existence of the keys on my computer keyboard wouldn’t affect the output:

However, I found that no amount of purely geometric de-skewing is going to perfectly capture the four corners of the slide, simply due to the fact that there could be obstructions, and the angle might be drastically different depending on where the user is sitting in the classroom. This led me to believe that we could use this deskewing as a preprocessing step, but we’ll likely need to build out an ML model to detect the exact coordinates of the four corners of the slide.

I tried using contour mapping to find a bounding box for the slide, but this didn’t work well when there were big obstructions (which definitely can be present in a classroom setting):

Here the contour is mapped in the red line. It seems okay, but the bottom left corner has been obstructed, and thus has shifted upwards a little. It would simply be a better solution to train a model to identify the slide coordinates.

I tried using combinations and variations of some functions used in image processing that I found online: blur, thresh, opening, grayscale, canny edge, etc. Eventually, I found that the best output was produced when applying a combination of grayscale, blur, thresh, and canny edge processing:

All of this produced the following output:

Use Case & Application & Problem: visually impaired paople cannet easily read text on whiteboards and Slides in the classroom, as a professer Is presenting.
® Scope: our solution addresses reading text during a lecture/presentation.= ‘The device will be a universal camera attachment which clips ento glasses, uses an ML medel to extract text, and reads the text aloud to the user through an OS app upon a button press.

So, I looked into post-processing methods using NLTK, Symspell, and TextBlob. After testing all three, NLTK’s autocorrect methods seemed to work the best, and provided this output:

Use Case & Application & Problem : visually impaired people cannot easily read text on whiteboards and Slides in the classroom , as a professor Is presenting . ® Scope : our solution addresses reading text during a lecture/presentation . = ‘ The device will be a universal camera attachment which clips into glasses , uses an ML model to extract text , and reads the text aloud to the user through an Of app upon a button press .

There were errors with respect to the bullet points and capitalization, but those can be easily filtered out. Other than that, the only two misspelled words are “Of” which should be “iOS” and “into” which should be “onto.”

After all of this processing, I used some ChatGPT help to write up a quick program (with Python’s Tkinter) that could help us tag the four corners of a slide by clicking on the edges, with a button that allows you to indicate whether an image contains a slide or not. The following JSON will be outputted, which we can then use as validation data to train our future model:

[
  {
    "image_file": "filename",
    "slide_exists": false,
    "bounding_box": null
  },
  {
    "image_file": "filename",
    "slide_exists": true,
    "bounding_box": {
      "top_left": [
        48,
        195
      ],
      "top_right": [
        745,
        166
      ],
      "bottom_right": [
        722,
        498
      ],
      "bottom_left": [
        95,
        510
      ]
    }
  }
]

Outside of this, I worked on the design presentation with the rest of my team. I am ahead of schedule, since I did not expect to do so much of the pre/postprocessing work this week! I actually had meant to build out the app this week, but I will update the schedule to reflect this change, since the processing seemed the most valuable to do this week.

Next week, I plan to write a simple Swift app that can communicate with a local Flask server running on my laptop. The app should be able to take in an image, send the image to the Flask server, receive some dummy text data, and use text to speech to speak the text out loud. Since I don’t have experience developing apps, most of this code (at least for this test app) will be scraped from the internet, as well as through ChatGPT. However, I will make sure to understand everything I implement. I also plan to take lots of images of slides from a classroom so I can start tagging the data and training an ML model.

For my aspect of the design, I learned the NLP postprocessing methods when I worked on a research project in sophomore year to recognize the tones of students’ responses when asked questions through a survey. I learned the image processing methods through working on planar homography for a lunar rover for the course 16-861 Space Robotics this semester. I haven’t specifically learned iOS development before, but I learned Flutter for a project in high school, and familiarized myself with the basics of XCode and SwiftUI through GeeksForGeeks last week, and I will use the principles I learned in 17-437 Web App Development to develop it. I am planning on implementing HTTP protocol, and I learned this in 18-441 Computer Networks.

Jaspreet’s Status Report for 09.23.23

This week, I focused primarily on preparing for the proposal presentation. My secondary goal was to do research on which hardware components we should be using for our design. These components are the camera, microcontroller, buttons, and battery.

I am behind schedule, as I expected to make more progress on selecting hardware components for our expected design. Therefore, I plan on spending extra time this weekend to catch up.

In the next week, I hope to have a completed first list of selected hardware components, with detailed explanations for why those selections were made. This includes listing out all components that were considered and the various tradeoffs between these components. SWaP-C must be considered for each component, especially since most of our use case requirements depend on the size, weight, and power consumption of our device.

Nithya’s Status Report for 09.23.23

This week, I did some more research on the models for Optical Character Recognition. Here are some of the sources I looked at:

Optical Character Recognition Wiki

Tesseract GitHub 

I learned more about which algorithm specifically allow OCR to work; OCR uses a combination of image correlation and feature extraction (both of which are computer vision methods that utilize filters) to recognize characters. 

I also learned that certain OCR systems, such as Tesseract (which we mentioned in our proposal, and is open-source), use a two-pass approach. On the first pass-through, the system performs character recognition as usual, and on the second pass-through, the system actually uses the characters that it recognized with high confidence on the first pass to help predict characters that it was not able to recognize on the first pass. 

I looked into post-processing techniques for OCR, which is something we might decide to try to improve accuracy. This involves getting the extracted text and then comparing it to some kind of dictionary, acting as a sort of ‘spell check’ to correct inaccurately-recognized words. This may be harder to do if there are proper nouns which don’t appear in a dictionary, so I’d like to try an implementation with and without post-processing, and compare the accuracy. 

My progress is on schedule, as this week was meant for researching OCR models. 

For next week, I will create a small test project using Tesseract and play around with the hyperparameters and training set, in order to ascertain the current level of accuracy that this system can achieve. 

Aditi’s Status Report for 09.23.23

This week, I started to familiarize myself with Swift and XCode. I decided to watch the following tutorials first:
1. Swift Essentials
2. XCode Tutorial

And I continued to read through some Swift documentations, as well as the entire Swift tutorial on GeeksForGeeks. I wanted to be as thorough as possible in this so that in the weeks following, I would be able to catch any errors, and also focus on optimizing the application if that becomes an issue.

The rest of the work done this week was group work: we discussed which parts to order and how we could improve our project based on the presentation feedback we received.


Team Status Report for 09.23.23

We have identified a few risks that could jeopardize the success of the project. Some of these challenges include optimizing the speed of data transfer and ML model (because we need the user to receive feedback in real-time), dealing with transcribing/reading math symbols and equations, performing extraction on poor-quality images, and making sure that the power consumption of both the device and the phone are appropriate for the device to be useful to user throughout the school day.

We have come up with some risk management plans, which include potentially switching to a smaller-size NN to reduce latency, including a wide variety of training images (which have mathematical symbols, low-contrast, blurry, etc.), making sure we have a high-quality camera to capture images, and switching out components for more power-friendly alternatives if needed.

The major change we made was narrowing the scope of the project to only perform text extraction and reading on presentations in classroom settings. This change was necessary since gathering enough training data for the system to perform recognition on any setting would have been difficult, and we wanted to prioritize the accuracy of our system. The change did not incur any costs in particular, but if time allows, we may expand our system to perform scene description on images included in a presentation.

Here is our most recent schedule:

Here is our most recent block diagram:


For our project, we had to consider multiple ethical concerns in order to make sure the product was as accessible to the public as possible. One specific concern we addressed was welfare: we wanted our product to be comfortable for the user, and we didn’t want it to detract from their overall learning experience, so we are planning to develop our device to be as lightweight and convenient as possible. Welfare concerns are extremely important to consider whenever developing a product, because we want to make sure that the user is as comfortable as possible, and we must make sure that it is accessible to everyone: a product might be convenient for some people, while not so much for others. Both of these kinds of people are valid users, and a product should be developed with both kinds in mind so that as many people as possible can benefit from the device.