
This week, I mainly worked on looking into data sources for training the graph description model. Of course, we will need a significant number of images of bar graphs, line graphs, scatterplots, and pie charts for training the graph description algorithm, even though we are planning to use pre-trained weights for the CNN-LSTM model.
For a dataset, here is one Kaggle dataset that contains 16,000 images of graphs, separated into 8 classes – this includes bar charts and pie charts, both of which we need for our use case. It was difficult finding a source which contained scatter plots and line graphs. One alternative to trying to find a single source containing a collection of graphs is web scraping, using Beautiful Soup. Essentially, if we have a list of websites, we can write a Python script as described here (https://www.geeksforgeeks.org/image-scraping-with-python/) to extract any images from that site. We would have to manually get these URLs and also filter out any non-graph images that are found this way, but it is another way we can gather data.
I also looked into some methods for increasing the number of images in our training set – some of these augmentation techniques are randomly cropping the image, flipping the image horizontally, changing the colors in the image, etc. Many of these, like the random crop and flipping the image, unfortunately may not be well-suited for graphs even though they are common augmentation techniques for CV tasks in general.
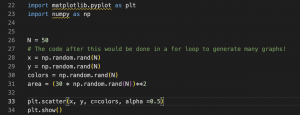
Another idea I had was to have some Python program generate graphs for us. This would be particularly useful for line and scatterplots, where a lot of the data on the x and y axes could be randomly generated using numpy. For this idea, we could also come up with a large list of axis labels so that what the graph is plotting wouldn’t be the same for all of the computer-generated graphs. Overall, I think this idea would allow us to generate a lot of varied graphs in a small amount of time, and would be a good addition to the data that we are able to gather online.
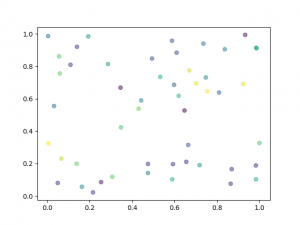
Here’s an example of what the random graph generation code would look like, as well as the resulting graph (these would be supplemented with axis labels and a title of course):
My progress is on schedule, as my goal for this week was to look into some graph data sources. For next week, my goal is to get started on understanding the code for the CNN-LSTM model, making changes to the architecture, and potentially begin training on the images of the Kaggle dataset.