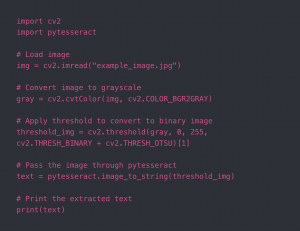
This week, I set up PyTesseract on my computer and was able to test it with a few images. Getting the tesseract module on my M1 Mac was a little challenging since certain packages are not compatible with the M1 chip (as opposed to the standard Intel chip). After getting that working, I tried running tesseract with a somewhat low quality image of my student ID card, and the results from that were fairly good, although certain parts were misidentified or left out. For example, my student ID number was correctly identified, but “Carnegie Mellon University” was read as “patnecie Mellon University”. Given that we will mainly be performing text recognition on very high quality images with our new change of pre-uploading slides, I don’t think the accuracy of PyTesseract will pose a large problem for us. This is the code I used for testing tesseract:
I learned from visiting this site (https://tesseract-ocr.github.io/tessdoc/Data-Files-in-different-versions.html) that tesseract already has support for identifying math symbols and equations. I hope to test this out more thoroughly next week, but preliminary results from this week seemed promising (identifying numbers and symbols like = correctly).
Since we decided to extend our use case by identifying and generating descriptions for certain types of graphs, I did a lot of research on how this would work. Initially, I looked at a few papers on the topic of “scene understanding” and “scene graph generation”, which is a similar problem to the one we are trying to solve; this involves building relationships between objects identified in images in the form of a graph.
I went on to look at papers on the topic of image description/captioning, which I feel is the most relevant to our graph description problem. From this paper (https://aclanthology.org/P19-1654.pdf), which actually proposes a new metric for measuring how accurate descriptions of images are, I learned that there are 2 standard methods of evaluating image descriptions/captions. The first is by human judgment – ask a person to rate the overall quality of a description and also rate based on certain criteria (relevance fluency, etc.). The second is automatic metrics, which compare the candidate description to a human-authored reference description. This is typically done by Word Mover’s Distance, which measures the distance between two documents in a word embedding space. We will use the same metric for our graph descriptions.
Courses which covered the engineering, science, and math principles our team used to develop our design include 18-240, 16-385 (Computer Vision), 18-290, 18-491 (Digital Signal Processing), 11-411 (Natural Language Processing), and 18-794 (Intro to Deep Learning & Pattern Recognition for Computer Vision). The last course in particular has already helped me a lot in understanding the different types of computer vision tasks we need to solve and the appropriate algorithms for them.
My progress is on schedule as this week, my main goal was to get PyTesseract working locally and start testing it out. Since we also made some changes to the use case, I updated my tasks in the schedule to focus more on the graph description model.
For the next week, I want to do more research into and maybe begin implementing the first version of the matching algorithm (for matching images of slides to pre-uploaded slides). I will also begin collecting and labeling graph data with my teammates.