There has been a lot of progress on the ML models in the last two weeks.
1.I gathered and annotated 1000 real slides from lectures with graphs to augment the dataset.
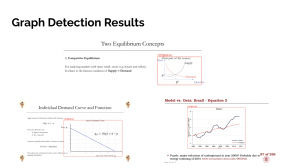
2.I trained and evaluated the graph detection model (YOLO) – this was fairly successful, but there are some small issues with the bounding box cutting off axis labels. Here are some example results.
3.I labeled 850 images of captured lecture slides, modified Siamese network, and trained it twice (once with class imbalance and the other with balance). This didn’t work so I switched the approach to a combined integer detection and then classification problem.
4.I wrote a script to go through all lecture PDFs and extract slides as images. I wrote another script to place the slide number in a red box in the bottom right corner of the image. There was a lot of iteration required for this in order to produce the best possible image for number detection.
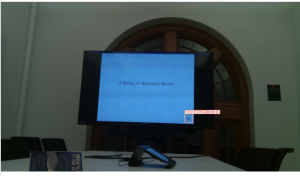
5.I gathered and annotated bounding boxes for 1000 lecture slides with the slide number in the particular format described above. I trained the object detection model YOLO to detect these slide numbers, which was successful. Here are some example results.
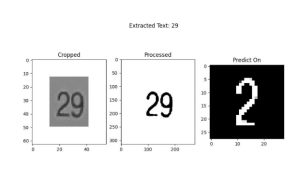
6.We tried using image processing methods such as denoising, thresholding, etc followed by tesseract (OCR) to extract the number from the cropped detected bounding box. This was not successful, so I switched to MNIST multi digit detection approach. I implemented a CNN from scratch which would classify each of the detected digits. I gathered and labeled about 600 images to augment the MNIST dataset for slide matching. I wrote a script to extract graphs from the 1000 gathered lecture slides. However the results of this were very poor, so we decided to switch back to the detection and processing approach, except using a simple MNIST classifier instead of OCR. This was fairly successful with an accuracy of 73% on a test set of 110 images from TechSpark. Here are some examples.
7.I wrote a script to generate 5000 each of line and scatter plots as well as reference descriptions.
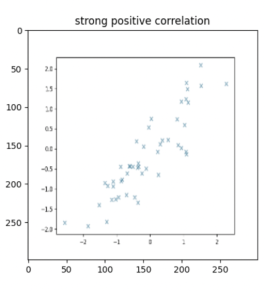
8.For graph description, I modified the CNN-LSTM code and helped write sample descriptions for the approximately 780 graphs we captured and extracted in TechSpark. Here are the results for a scatterplot:
9.I helped Aditi with integration of slide matching by compiling detection and ML models into the proper format.
We are on schedule – what still needs to be done is improving the slide matching model and simply training and evaluating the graph description model, which will be done tonight and tomorrow. We will continue to make improvements and finish the integration tomorrow.