
For this week our group was finishing our last bits of testing on our whole system, and working on making sure our web server is working. We have also started working on making our final presentation poster. I have been spending my time specifically testing our rerouting implementation and different routes with more cars, and using this to create more graphs for our final implementation. I have also spent quite a bit of time refining our final presentation poster so we are ready for our poster session. Super excited to showcase everything we have accomplished!
Goran Goran’s Status Report – 4/23/22
For this week again our group was putting the finishing touches on our complete project, but we also have the final presentation coming up next week so a significant portion of our time has been dedicated to that. On the finishing touches side of our project, I have finished writing a script for our operators view or dozens of cars being rerouted at the same time. I have ported all of the information of all these possible routes for the cars, and run it through a few simulations. A case where routes are picked entirely randomly. the first route is picked. and a “best” version where the route with the least overlap is picked. Now I am just deciding how the best way to present this data is, whether it be graphical or what not. I am also in charge of doing next weeks presentation, so I have been making sure that I have an intimate understanding of all aspects of our project, including the portions I was not directly responsible. We are now starting to make our powerpoint and should have that done by Sunday night. Everything seems to be on track, I am excited to present everything we’ve accomplished so far!
Goran Goran’s Status Report – 4/16/22
For this week our group was mainly working on testing and refining our individual components as the deadline fast approaches. For rerouting that means that I have spent this week focusing on trying to create an operators view of the entire mapped area, showing how multiple cars are being rerouted. For now that means our goal is to have approximately 20 cars and their routes with respect to each other tracked and be able to show that their updated routing is improving their overall experience. In that regard I’ve run into several limitations for of the API software, since it limits me in the amount of requests I can make, my hope for creating a constantly updating map showing the routes seems to be a pipe dream. What I have been working on, and continuously tweaking is creating an excel document, showing each of the routes taking my the cars. I plan on cleaning up this data and creating visuals in the form of graphs showing changes in the travel time, and which streets are made more traffic heavy by the rerouting algorithm. So far everything seems to be going on track to make that happen by our Monday meeting.
Goran Goran’s Status Report – 4/09/22
For this week we spent the majority of the time making sure that our subcomponents are working seamlessly together. I spent my time making sure that our rerouting software was able to correctly and quickly receive and show updates on the generated map based on user input information. The rerouting is now able to work interactively with the crash detection aspects. I will continue to make use of some predetermined intersections spread around Pittsburgh and test to make sure that our software works robustly in all situations. For my focus on this coming week, I will attempt to make a operator view of our rerouting simulation, so that they can access and see all the different routes users are on to show that these routes are being distributed well without many issues.

Goran Goran Status Report – 4/2/2022
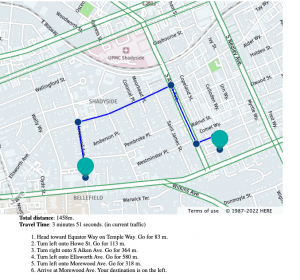
For this week in preparation for our “interim demo” (in quotes since Professor Kim is out of town this week), we have been trying to combine our different subsystems into one cohesive system. Although all of the kinks and features of my rerouting subsystem have not been figured out, what exists so far has been combined with everything else. At the moment the rerouting is able to constantly update based on information from the traffic light about the state of the road. It will provide the fastest route and give the user a detailed map, time to travel, turn by turn directions, and distance travelled. Anytime a crash is detected the map will automatically refresh in real time, giving a seamless user experience. For the future I plan on adding a simulation on top of the rerouting map for the operator to see cars traveling and how they are being rerouted by the system. Below is an image of the current rerouting at work.
Goran Goran’s Status Report – 3/26/22
For this week our group focused on the implementation of many of the ideas that we have previously been talking about. I focused on finally making use of the HERE Api system to actually achieve dynamic rerouting. I was able to get to the point where I can create a live server hosting the map data, which when given an origin, destination, and an intersection to avoid it will provide us with different sorts of routes that a car can take through traffic. In the future I hope to add more user functionality onto the server for the crash detection, as well as provide constantly updating simulation data for the operator. Just so that the operator will be aware of how traffic is flowing and the general trends that exist. There’s no point in rerouting if it just ends up causing even more delays in the long term.
Pre crash on fifth:
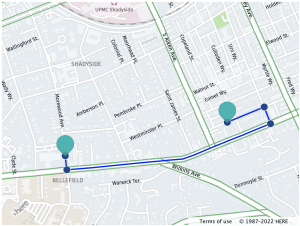
Post Crash on fifth:

Goran’s Status Report – 3/19/22
For this week our group tried to get back into the groove of work following our Design Review and spring break. Right before spring break I realized that it became necessary to fully pivot away from the Spatial Network Analysis route for rerouting. We had not really nailed down our definition of what rerouting was until now, previously I believed putting the responsibility on users to go to a specific website to get rerouting information was too placing too much faith in them, but I now realize that is necessary. Planning on using traffic lights to control traffic was both impractical and infeasible.
Now I have been making myself familiar with and using the HERE maps API, along with the React WebApp framework. Our goal is to have the rerouting information publicly available on a web server and allow for users to insert their own locations and destinations. Given an area that a traffic light has blocked off, we can make use of the routing API to find alternate paths.
Design Review Report
Goran’s Status Report – 2/26/22
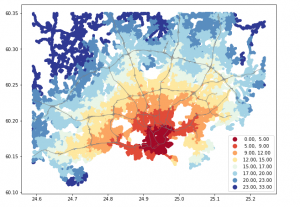
For this week our group worked on both our Design Review and continuing our work from the earlier week. We spent a lot of time working on detailing out specifics for our projects, which included constraints, requirements, behaviors, algorithms etc. This week I continued work on our rerouting implementation, but after going through our design review and hearing feedback, I started to think about the actual usability of our rerouting design. Right now simply using traffic lights to control traffic does not seem to be very useful in rerouting as one it doesn’t give a lot of information and two we have no way of knowing the general path of the individual drivers. We are still thinking of ways we can include our rerouting work into our final project, so as of now I have decided to continue on this general trajectory and think about how I can fine tune it to be more useful. Below is a block diagram of our intial thoughts towards rerouting. I have also compiled a map showing travels times driving from a central location in Helsinki. This shows us how quickly one can travel in between different points of Helsinki. One way we can pivot our rerouting work is to be able to create maps showing updated travel times based on an input location and having that appear on a website, up to date with added lane closures etc.

.