Team Status Report

We are all in beginning implementation stages for our respective parts. Nolan has begun working with the chroma toolbox in Matlab, Wenting is beginning test data visualizations, and Anja is working on input discretization.

We originally wanted to do audio processing in C, but the libraries have not been conducive to productivity and work efficiency. Instead, we plan to use Matlab for the audio processing.

There are no new risks, but we are still concerned about the performance of our system in both accuracy and speed. We may have to lower the threshold of what is considered a “match,” though that may also result in false matches. Our original goal was to match in under 1 minute, and we hope to still meet that goal, though we may prioritize accuracy over speed if it comes down to it.

Wenting: Status Report 5

This week I developed a very basic dummy implementation of how the melodic contour analysis part of data visualization will be displayed. An example is shown in the figure below. The actual graphic would show the musical notes on the side (per the example we put in our design document, also attached below), but you can see in this graphic how the melody matches at some points and deviates at others.

I am also (in conjunction with Anja) looking at C libraries for processing audio so that I can try filtering background noise out of the sung input.

As mentioned in a previous status report, there are cool ways of visualizing at the convolution and filter layers in a CNN. Now that I have seen the background on it, I will be looking more into how to actually implement it.

Finally, I began UI design for the final app – sketches shown below.

Wenting: Status Report 4

I spent the first part of this week working on the design document. This involved putting the technical details of the project in a more concrete, detailed, and professional form. It was a significant undertaking that took a lot of time and thought, and hopefully that will pay off come the final report!

Unfortunately I had a very busy week in other classes and was not able to dedicate as much time to capstone as I would have wanted to. I did spend more time looking into existing visualizations of CNNs and possible implementations for visualizing melodic contour analysis. Anja drew an example for the design review slides that is very viable – displaying the sung elody on top of the melody of the match (or top possible match(es)). The consideration is whether or not the visualization can be done real-time, and whether a timeline-like graphic will be possible. The idea for that is that it would a video/gif that would show the melody from start to end, with the beginning being matched to all songs and then with each note, songs that are not the match are shown to be eliminated (i.e. they disappear from the graphic) until only the final match(es) are shown.

In this article, there are examples of the intermediate convolutions, the ReLU activiation filters, and the convolution layer filters. They also showed examples of class activation heat maps, which I have some experience with from my previous research experience. I don’t think the heat map-type visual will be relevant to us, but the others are intriguing. Another visual I saw was this one that shows what I assume is a simplification and distilled version of the their CNN is doing. The input is shown, and some granularity of the layers in between, down to the final classification. These are inspiration for what the final visualization system will be.

My limited time kept me from beginning implementation but I plan to get started as soon as possible on building a test visualizer for melodic contour and tinkering more with CNN layer visualization. Additionally, I need to look into filtering background noise out of input audio.

*Note: Since it is spring break this is being written earlier than usual


Wenting: Status Report 3

In the process of putting together the design presentation and design document, we have decided to take two parallel paths on our project, as described in our team status report. One will follow a similar path to the query by humming project that will match against a MIDI library, while the other will use chroma feature analysis to examine similarities between MP3s.

From the data visualization standpoint, the two approaches will be generating results in two different ways. Since the first approach will be borrowing work from other research, I am not completely sure how that will be able to be visualized – whether it will be a black box computation or whether I can extract out its process to display it. The second approach will follow what I mentioned last week with showing the similarity matrix.

While the UI design of the app will be done later, I have begun the process of deciding on its functionalities and features. Similar to the existing Shazam, users will tap to begin singing and matching. We hope to have sliders for the user to weight melody and rhythm differently depending on what they are more confident in. Once our algorithm has finished processing, it will pop up with the matched song or no match if it could not find anything. Either way, the user will be able to see some of the work that was done to match the song. The level of detail that we will show initially is yet to be determined (for example, we can include a “see more” button to see more of the data visualization aspect). The app will maintain a history of the songs that have been searched and potentially the audio files that it has previously captured, thus also maintaining a history of what has been matched to the song before as well.

Now that our design is more concrete, we have reached the phase where we are going to begin implementation to see how our methods perform. I would like to begin data visualization with some test data to see how different libraries and technologies will fit to our purposes. Also, in conjunction with Nolan, I will be looking into chroma feature analysis and using CNNs to perform matching.

Wenting: Status Report 2

This week our team met with Professor Roger Dannenberg to get his insight into our ideas and what would be more plausible for our project. He told us some more details about the query by humming project and how its poor performance resulted in it not being a product that could go on the market. The act of breaking down music into separate lines is actually quite difficult since it’s hard to determine instrument lines and such. He mentioned F0 estimation which tries to find the primary note at each instance, which is essentially melody tracking, but also has mixed results. His suggestions have shifted our path more towards looking into using similarity matrices to match the songs. Similarity matrices essentially plot one song against another, and searching for diagonals locates the places where the two songs match up.

The similarity matrix idea also helps to play into the data visualization aspect of our project. Matrices are inherently visual so if we end up using this technique then the work that has been done by the matching algorithm through the matrix can be shown.

A point brought up during our weekly meeting with Professor Savvides and the TAs was that including a data visualization portion would help with debugging as well. I read this article which addresses some of the existing software that people use for similar things, such as Tensorflow Graph Visualizer. We will probably end up using those softwares, or at the very least employing techniques from them.

Unfortunately I have technically fallen behind schedule. I did not anticipate how much more research and planning we would have to do before moving on to other tasks, such as designing the data format. However, I have furthered my understanding of the problem at hand sooner rather than later, so I have a better idea of what will work now rather than having to turn back to try a different solution too late.

For next week, I would like to have a more concrete plan of how we are going to go about implementing both the audio analysis and the matching algorithm and explore how that will interact with the data visualization aspect of the project.

Team Status Report 1

  • What are the most significant risks that could jeopardize the success of the project? How are these risks being managed? What contingency plans are ready?

    The biggest risk of our project is the matching algorithm performing very poorly. As elaborated further in the next point, existing papers have shown that query by humming, a similar project, has poor performance. We will have a very limited library of songs that we will match to. Our contingency plan for this is to add a data visualization aspect to the project to show the work that the matching algorithm has done, even if it cannot actually match it to a song. For example, it can display highlighted portions of the melody that it found to be a match or close match.

  • Were any changes made to the existing design of the system (requirements, block diagram, system spec, etc)? Why was this change necessary, what costs does the change incur, and how will these costs be mitigated going forward?

    We might not do dynamic processing on a flexible library anymore. ​Some papers indicate that preprocessing with the helpful use of MIDI file information (a broken down record of pitches and rhythms for each instrument in a piece) is widely used and much simpler. The cost here means that the focus of our project is to either analyze and process mp3 files or to do better data representation and search algorithms.

    The cost here is mitigated because our learning will be maximal — we can try out innovations to the existing algorithms since there isn’t much to lose.

    Realizing the potential lack of accuracy with the project, we decided to add the visualization component to the project, so that users can at least see the inner workings of our algorithms.

  •  Provide an updated schedule if changes have occurred.

    Our schedule is mostly the same, but we have updated our Gantt chart below with the changes highlighted. After further evaluation, machine learning may not be needed so we have generalized ML-related tasks to matching algorithm, and we have also added in the data visualization to the task list.

Wenting: Status Report 1

*Backlog from before websites were set up*

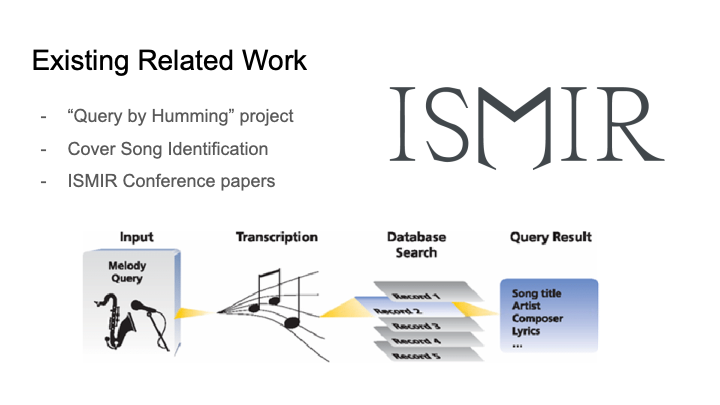
This week I did more thorough research into similar existing as well as related research that could be helpful for developing our solution. Roger Dannenberg, a CS professor whose primary field is computer music, has done a lot of work that is of interest for our project, including the query by humming project that we noted in our project proposal. We have been in contact with him and intend to meet with him soon.

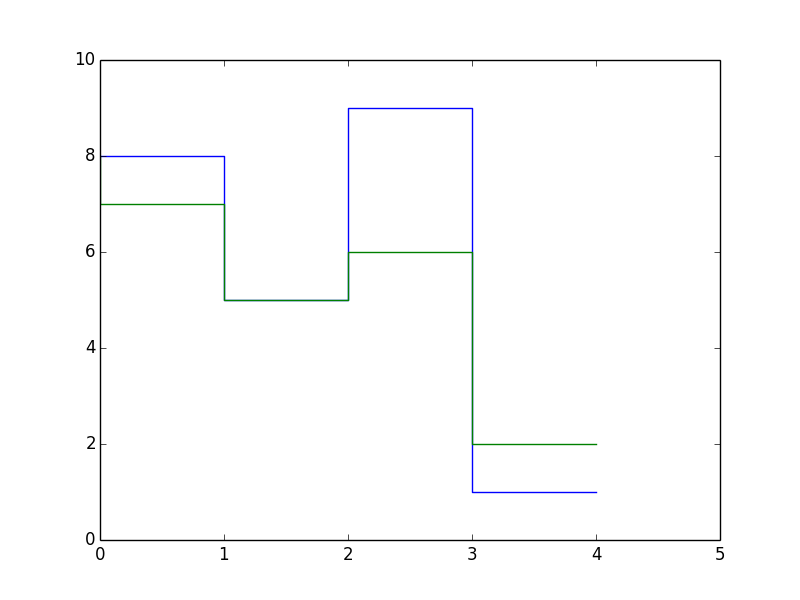
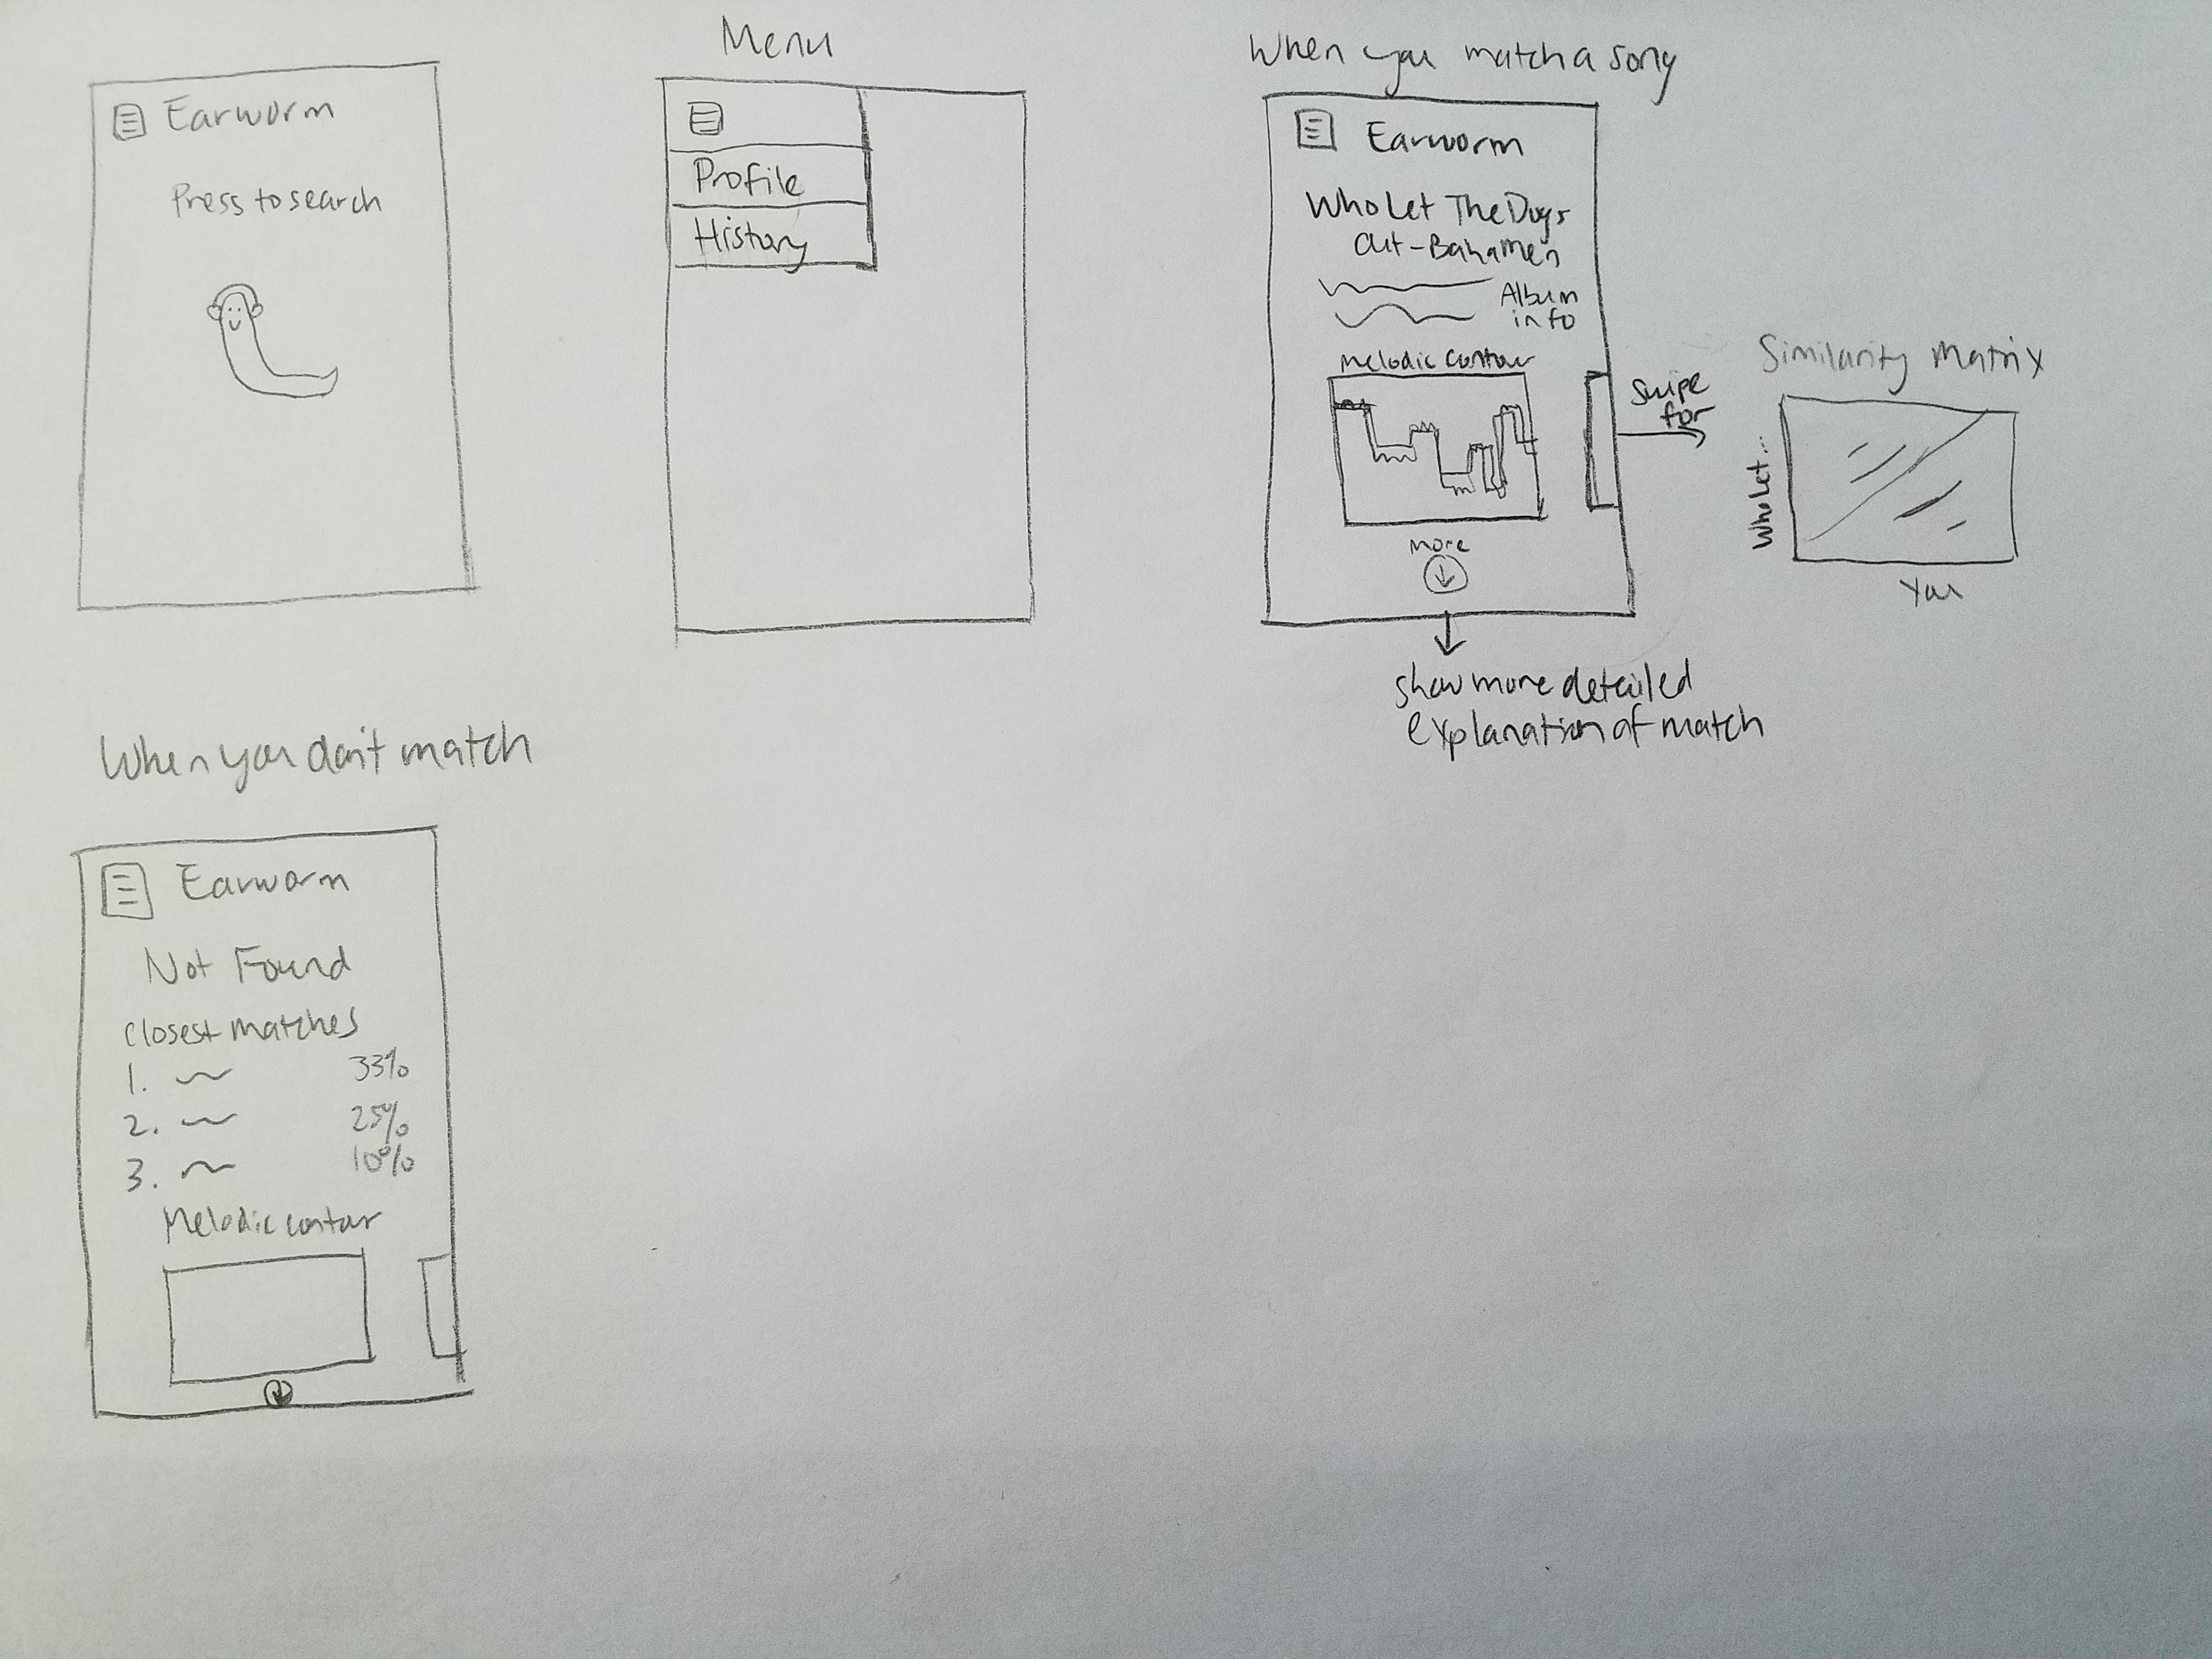
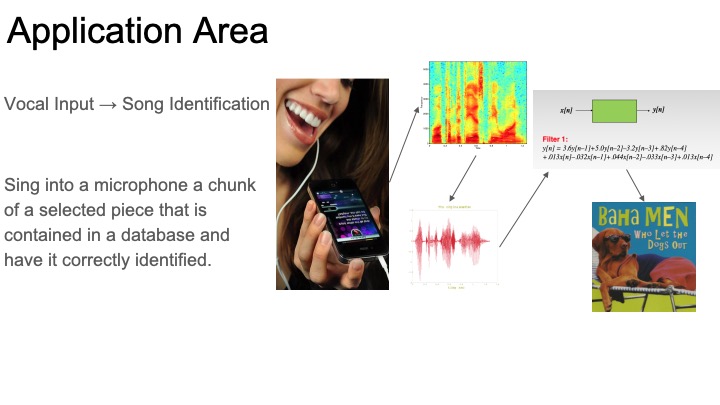
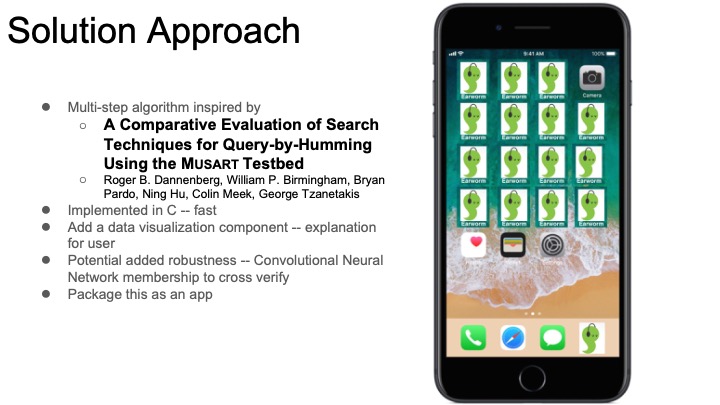
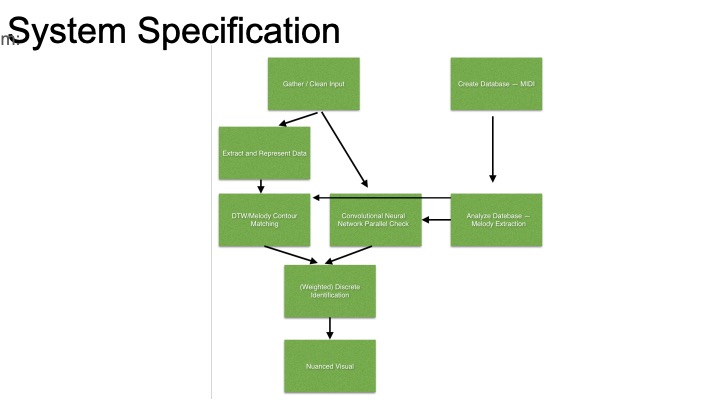
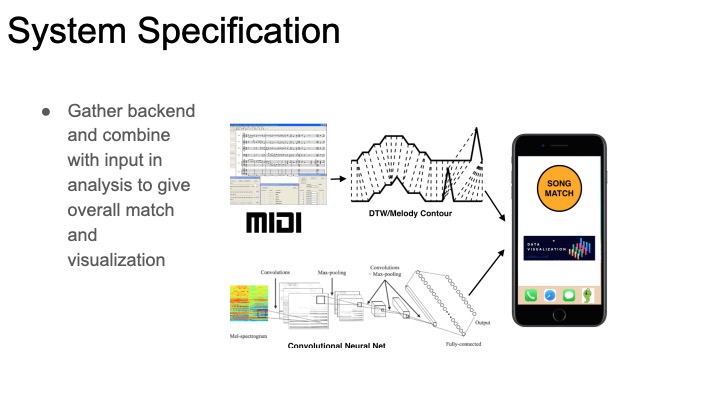
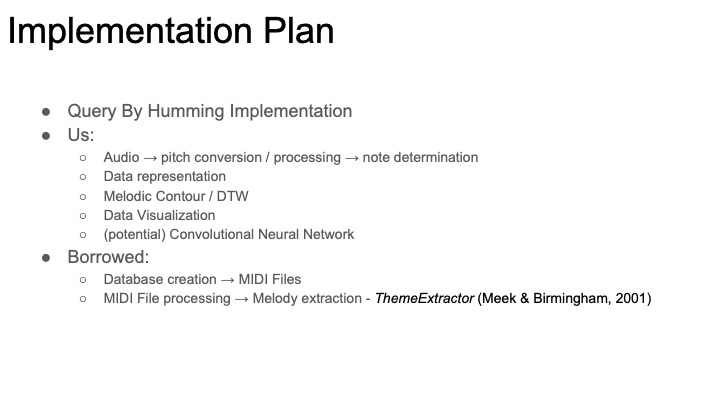
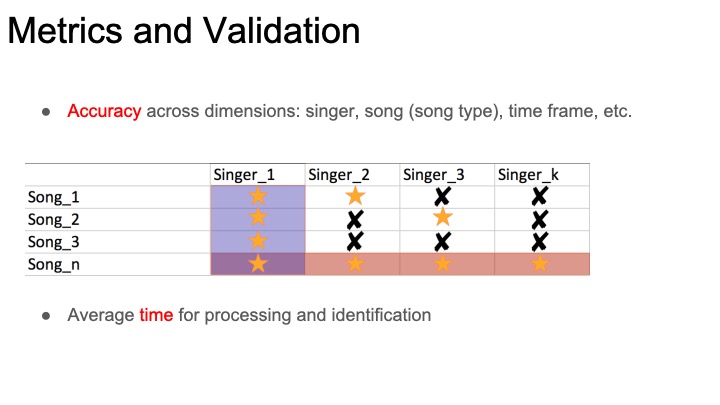
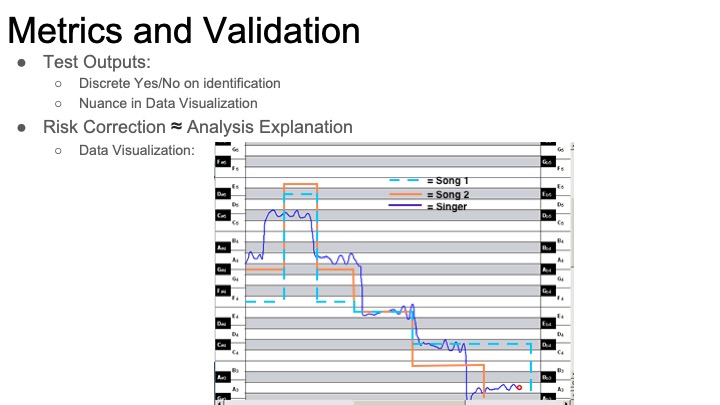
The projects I looked into were the MUSART query by humming project and his work in structural analysis. From studying the query by humming project, I found that our intended method for analyzing songs was more difficult and had more improbable success than previously thought. Our most ambitious idea was to analyze songs by breaking it down into multiple voices by applying concepts from polyphonic pitch tracking, but this project simply used pre-existing MIDI files for that instead of analyzing the raw audio of the songs. Also, looking at the performance of their system, our goal for 75% accuracy in recognizing songs may not happen. In order to counteract the possibility of our system not being able to match the song, I came up with the idea to do some sort of data visualization. Even if we are unable to find a match, the algorithm will have done some manner of work to try and match it. I would like to include that in the results of the query to demonstrate that it did, in fact, try to do something. An example of what it might show is a highlighted portion of melody that it matched between the input query and an existing song.

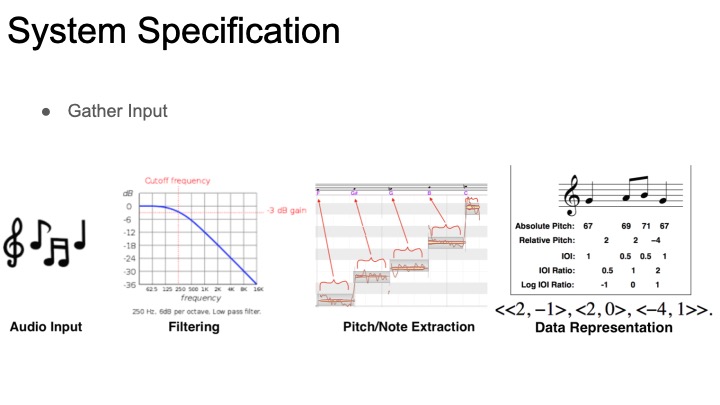
While browsing Professor Dannenberg’s work, I stumbled upon his work in structural analysis. The purpose of these projects was to make models that could analyze songs and provide an explanation of it, i.e. “the song is in ‘AABA’ form.” Our project’s intent is not that, but I figured the analysis methods from these projects were relevant to what we are trying to do. Much of this work was in looking for patterns in the music to discover the structure of the song, including ways to transcribe melody using monophonic pitch tracking, chroma representation, and polyphonic transcription. We will likely be doing something similar in order to extract information from the input sounds.

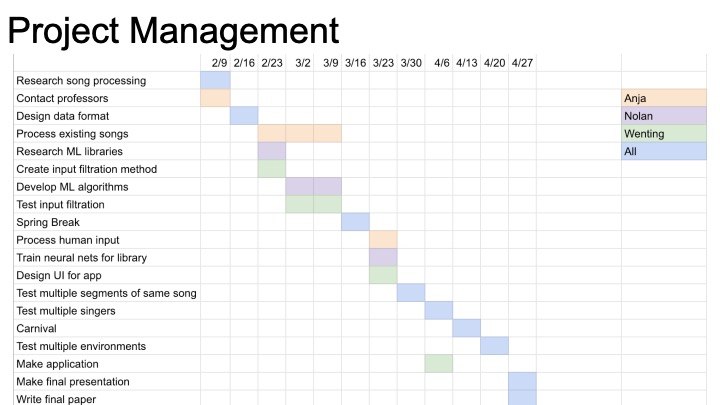
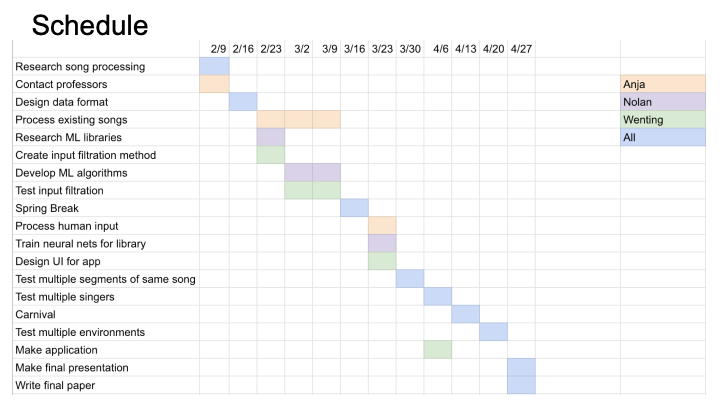
I am currently on schedule, but the research phase will probably continue into next week as we explore all our options and discuss further with professors such as Roger Dannenberg.

I’d like to have some semblance of our data format design, and I intend to do research into data visualization, though that will depend on the data format and matching method.