Wenting: The Final Status Report

I’ve made a ton of progress since last week. As mentioned last week, I was looking for a library to capture audio and had to do a lot of digging to find one to save .wavs, which is the audio file format being used for the backend processing. I’ve never worked with React before this so it has been a big learning experience.

I’ve gotten almost all the features for the web app implemented. The user can record a clip that is then posted to a Flask server and saved. The file is then passed to Matlab for processing and the results (melodic contours, matched song titles) returned back to the frontend for rendering the visual results. My last task is to get the results to display at the correct time. I have put together the design for displaying and just need to have it trigger at the right time (i.e. when the processing is complete).

Public demo is in 2 days so all I can say is it’ll be done by then. 🙂

Wenting: Status Report 10

This week I did more work on the app in both the visual design, adding pages, and connecting to the backend. My challenge this week was finding an audio recording library to use on the web app and integrating it with what I’ve already done. I also need work on how to trigger Matlab to run when the audio has been captured and then return the results back to the front end.

I am currently behind and have a lot to do before the final demo. I know the resources that I can use and reach out to for help though, so I am confident in my ability to get it done.

Wenting: Status Report 9

This week I worked on putting together the web app and refining visualizations. I currently plan on having the following visualizations:

For a matched song

  • A “percent” representing how close the match was based on a weighted score from melody contour analysis and the similarity matrix
  • The sung input plotted on top of the original song
  • Histogram showing the distribution of distances (difference between original and input)

For a non-matched song

  • List of top match(es)
  • The same visuals as for the matched song but for each song

Possible additional features

  • Link to the song on Youtube/Spotify
  • A Yes/No button to determine whether Earworm was correct or not (good for feedback?)

As of the coming demo, I will be on track and just need to do further refinement based on feedback and integration.

Wenting Status Report 8 + Team Status

Wenting:

This week I started playing with the histogram idea to show the distribution of distances to the actual melody. I am debating whether I want to show absolute distance or both positive/negative as that may determine whether someone was singing flat or sharp, or simply which way they were off by.

Again, I am behind schedule but will need to actually have the website built by the end of next week since the clock is ticking till final demo, and I need to work on integrating the data visualization into the website and with other parts.

Team:

As predicted, all of us were very busy with carnival commitments this past week and were not able to do that much. However, we will be majorly kicking into gear this week for each of our parts.

Although we are a little behind, we are confident about finishing what we need to get done.

Wenting: Status Report 7 + Team Status

Wenting:

This week I demo’d and received helpful feedback for the data visualization aspects. I was plotting the original song against the sung input (although both are still contrived examples and coloring the space between them with some color in the gradient from red to green, where red meant it was not a close match and green meant it was a close match. However, I neglected to include a scale which made it hard to interpret the graph. Since it is a gradient, the colors are not necessarily very comparable so it will be hard to discern particularly as the length of the sample grows and there are more colors in the gradient.

Suggestions from course staff included plotting the distances between notes and making a histogram to show the distribution of distances. Also, coloring the actual line of the melody as red/yellow/green is more indicative, and I think with that I could add toggle options to display just the sung input, the sung input and the melody it was matched to, or just the matched melody. This is an option that I have considered and am still tinkering with.

While I did most of my work for the demo in Python, I may port it over to Matlab for easier interfacing with the other parts. Also, I would like to start working on the pipeline from the two branches of audio analysis to data visualization, since that will be a key part of my portion.

I think I am a little behind schedule since I wanted to spin up a basic website by this week but that has not been done, and I would like to be further along in prototyping data visualization techniques.

Team:

Post interim demo, we are all working on pushing forward with the next steps on each of our parts. The suggestions and comments made by course staff were helpful for us to work off of for the next few weeks, and we feel confident that we will have enough time to finish what we have to do.

The risks that we are facing have not changed much, though there may be a big push at the end to put all the parts together into one system, which is to be expected. As this coming week is carnival and we all have commitments to carnival events, we will all be busy but will try to still be on track.

Some parts have not moved as quickly as originally estimated, but overall our team is in a good place schedule-wise – we know what we need to get done and have a good sense of time about it.
Wenting: Status Report 6

This week I delved more into the implementation of the data visualization techniques. I want for it to be visually obvious what parts are a close match and what parts are not, so there should be a red to green scale in some way or form, where red means that part is not a close match and green means it is a close match. This can be done through shading the differences between the graphs, or simply coloring the line representing the melody based on how close it is to the closest matched melody, though this would probably be harder to see.

A thought to consider is whether or not the input should be plotted against each song separately, or if the information can be aggregated into one visual. Using either of the methods mentioned above, they would have to be separate to be meaningful. I will be continuing to explore what methods are effective and most telling of the process.

I have not done much work on visualization for the CNN branch yet because it’s more difficult to do without data. To combat this I may try generating test matrices similar to the ones shown in this paper to explore some options. Perhaps using the similarity features we can pull out the bits of melody that were found to be matching.

Since our computation will largely be in Matlab, it may be easier to develop a web app instead of a mobile app. With that in mind, my goal for next week will be to spin up a basis/frame for the app.

Wenting: Status Report 5

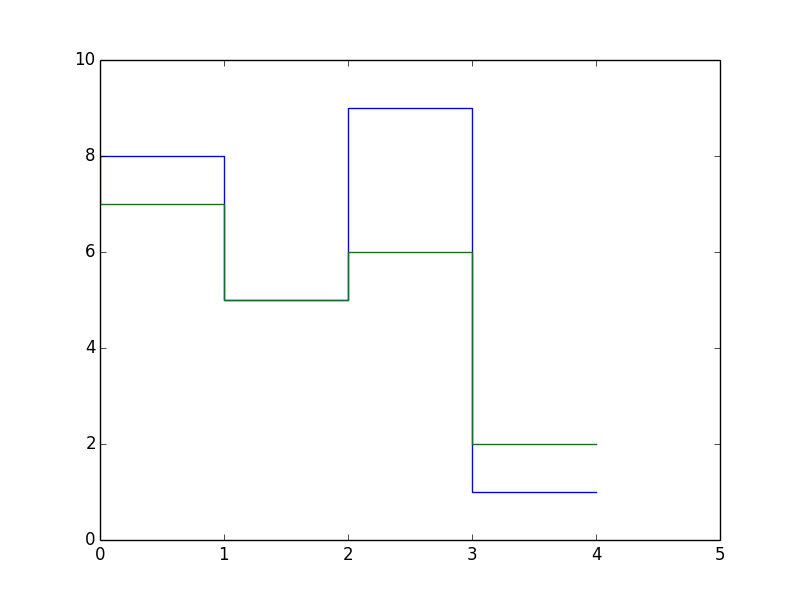
This week I developed a very basic dummy implementation of how the melodic contour analysis part of data visualization will be displayed. An example is shown in the figure below. The actual graphic would show the musical notes on the side (per the example we put in our design document, also attached below), but you can see in this graphic how the melody matches at some points and deviates at others.

I am also (in conjunction with Anja) looking at C libraries for processing audio so that I can try filtering background noise out of the sung input.

As mentioned in a previous status report, there are cool ways of visualizing at the convolution and filter layers in a CNN. Now that I have seen the background on it, I will be looking more into how to actually implement it.

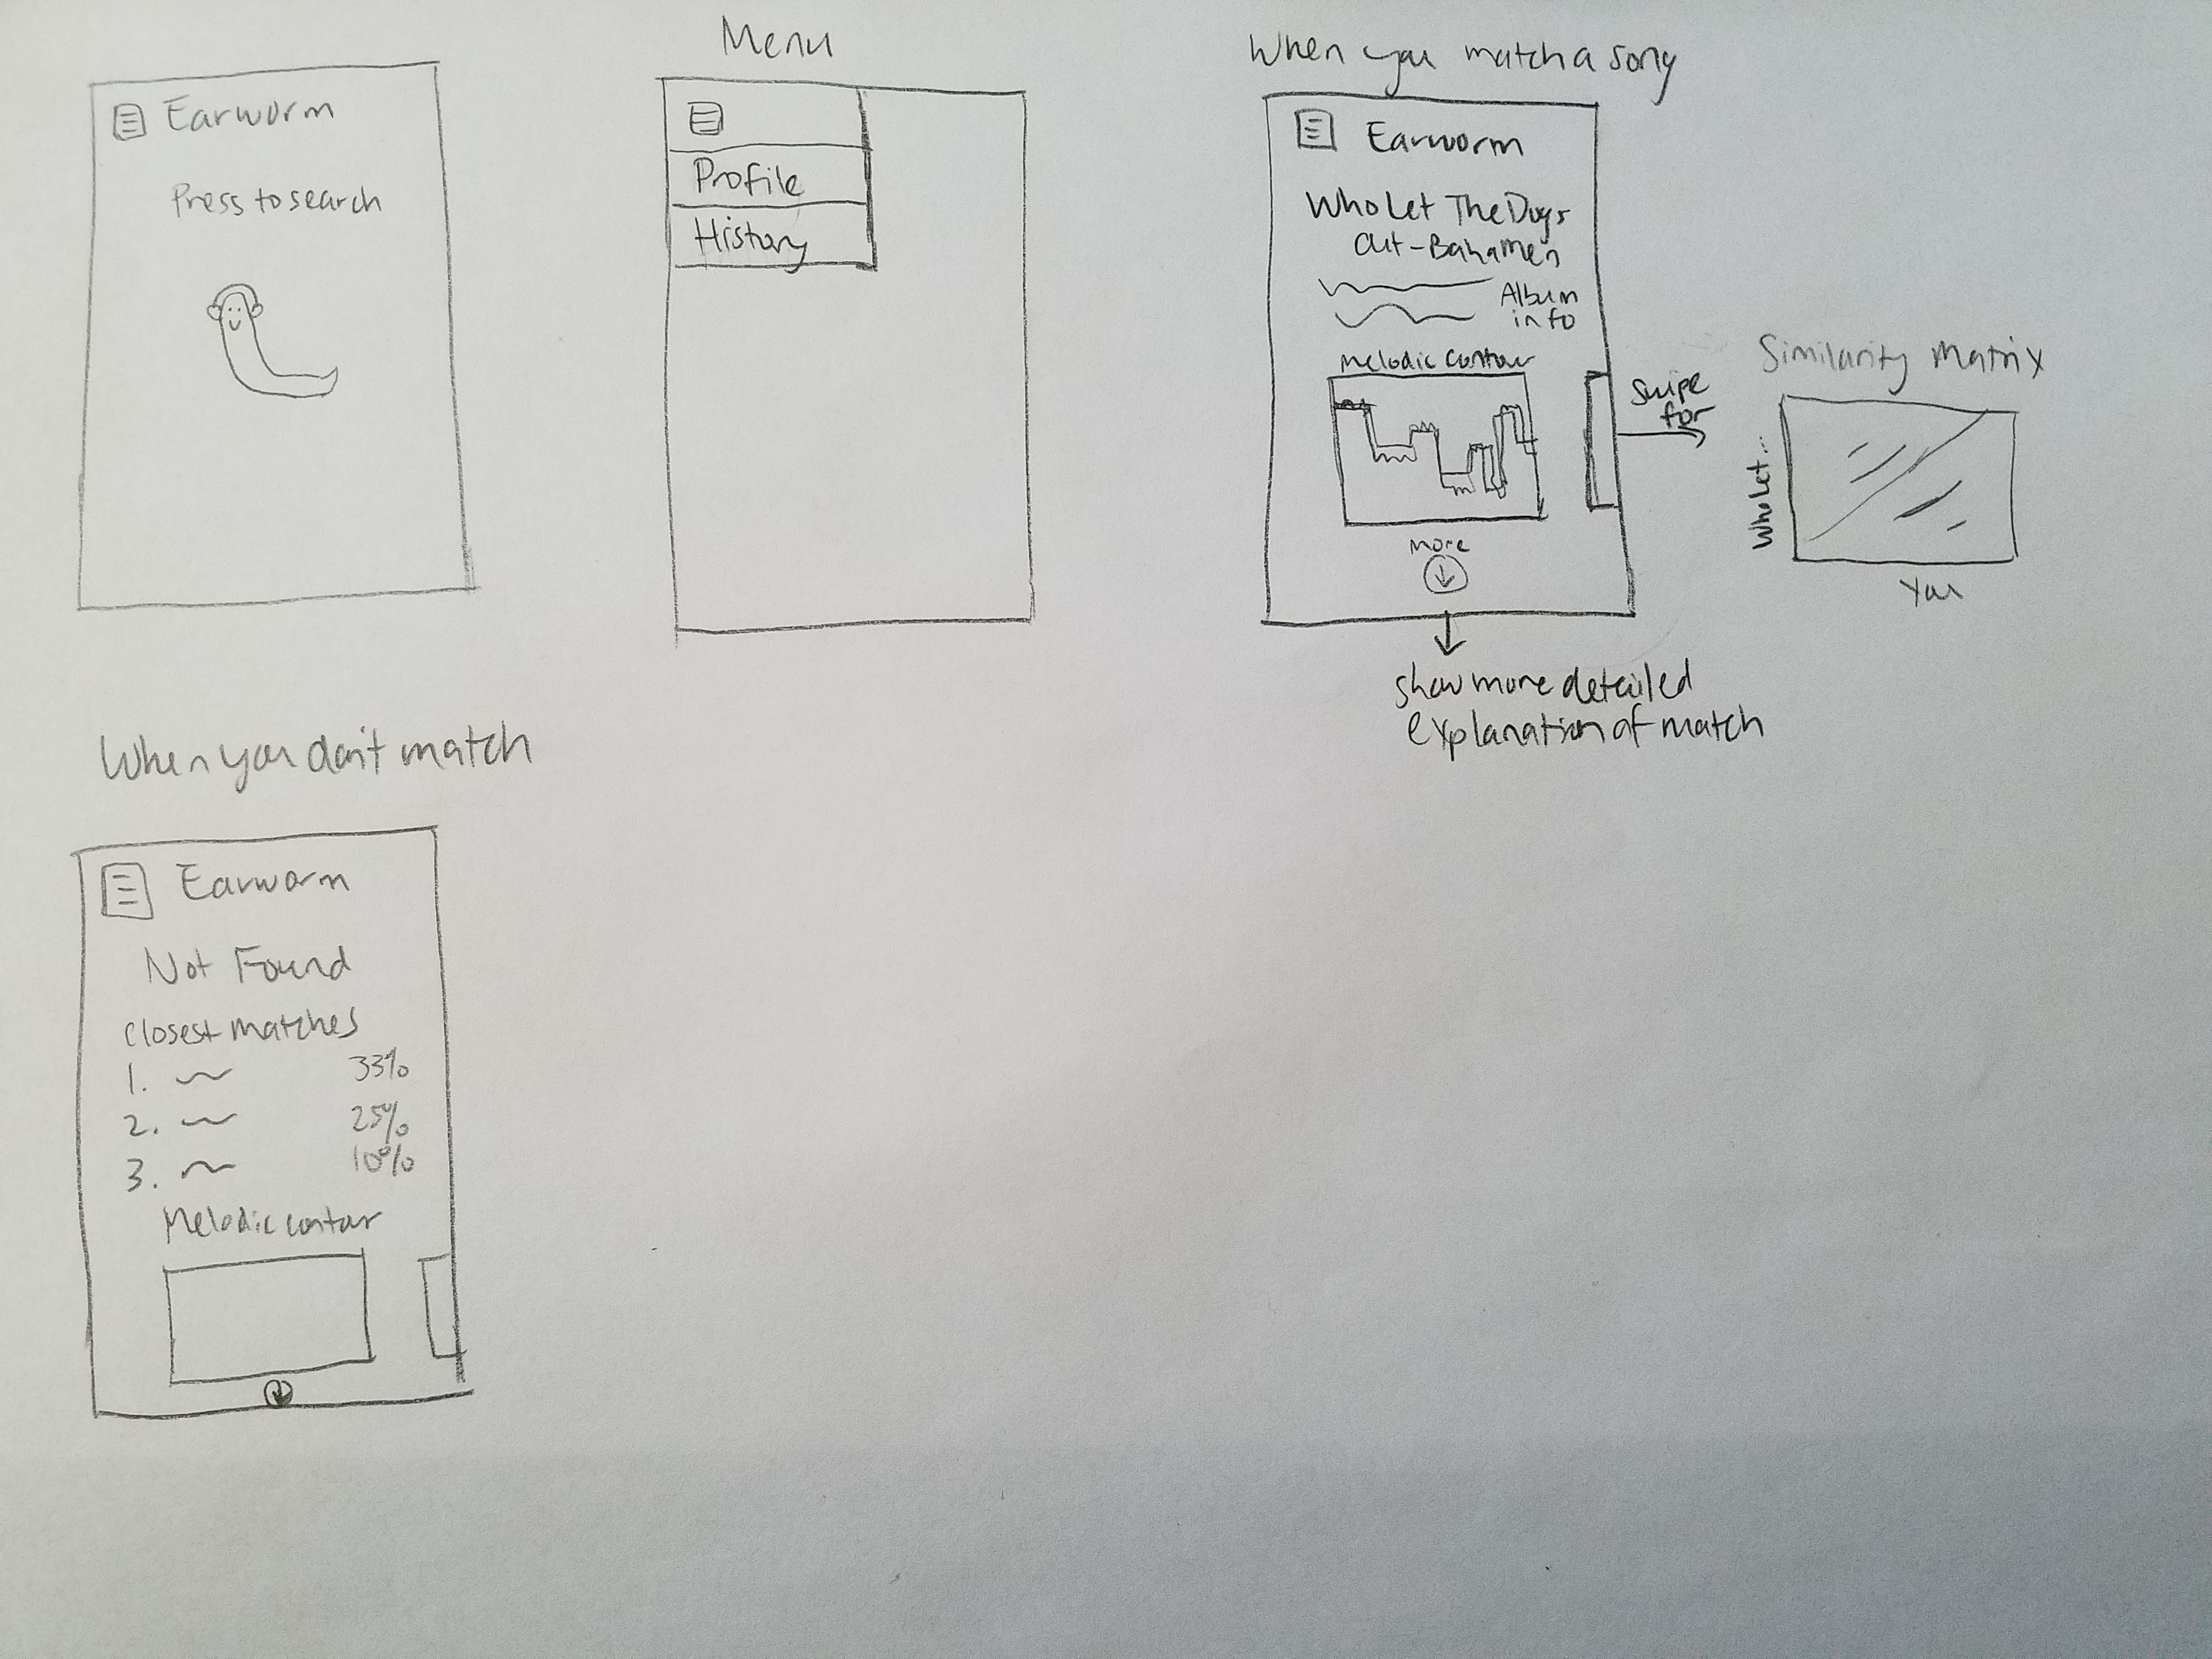
Finally, I began UI design for the final app – sketches shown below.

Wenting: Status Report 4

I spent the first part of this week working on the design document. This involved putting the technical details of the project in a more concrete, detailed, and professional form. It was a significant undertaking that took a lot of time and thought, and hopefully that will pay off come the final report!

Unfortunately I had a very busy week in other classes and was not able to dedicate as much time to capstone as I would have wanted to. I did spend more time looking into existing visualizations of CNNs and possible implementations for visualizing melodic contour analysis. Anja drew an example for the design review slides that is very viable – displaying the sung elody on top of the melody of the match (or top possible match(es)). The consideration is whether or not the visualization can be done real-time, and whether a timeline-like graphic will be possible. The idea for that is that it would a video/gif that would show the melody from start to end, with the beginning being matched to all songs and then with each note, songs that are not the match are shown to be eliminated (i.e. they disappear from the graphic) until only the final match(es) are shown.

In this article, there are examples of the intermediate convolutions, the ReLU activiation filters, and the convolution layer filters. They also showed examples of class activation heat maps, which I have some experience with from my previous research experience. I don’t think the heat map-type visual will be relevant to us, but the others are intriguing. Another visual I saw was this one that shows what I assume is a simplification and distilled version of the their CNN is doing. The input is shown, and some granularity of the layers in between, down to the final classification. These are inspiration for what the final visualization system will be.

My limited time kept me from beginning implementation but I plan to get started as soon as possible on building a test visualizer for melodic contour and tinkering more with CNN layer visualization. Additionally, I need to look into filtering background noise out of input audio.

*Note: Since it is spring break this is being written earlier than usual


Wenting: Status Report 3

In the process of putting together the design presentation and design document, we have decided to take two parallel paths on our project, as described in our team status report. One will follow a similar path to the query by humming project that will match against a MIDI library, while the other will use chroma feature analysis to examine similarities between MP3s.

From the data visualization standpoint, the two approaches will be generating results in two different ways. Since the first approach will be borrowing work from other research, I am not completely sure how that will be able to be visualized – whether it will be a black box computation or whether I can extract out its process to display it. The second approach will follow what I mentioned last week with showing the similarity matrix.

While the UI design of the app will be done later, I have begun the process of deciding on its functionalities and features. Similar to the existing Shazam, users will tap to begin singing and matching. We hope to have sliders for the user to weight melody and rhythm differently depending on what they are more confident in. Once our algorithm has finished processing, it will pop up with the matched song or no match if it could not find anything. Either way, the user will be able to see some of the work that was done to match the song. The level of detail that we will show initially is yet to be determined (for example, we can include a “see more” button to see more of the data visualization aspect). The app will maintain a history of the songs that have been searched and potentially the audio files that it has previously captured, thus also maintaining a history of what has been matched to the song before as well.

Now that our design is more concrete, we have reached the phase where we are going to begin implementation to see how our methods perform. I would like to begin data visualization with some test data to see how different libraries and technologies will fit to our purposes. Also, in conjunction with Nolan, I will be looking into chroma feature analysis and using CNNs to perform matching.

Wenting: Status Report 2

This week our team met with Professor Roger Dannenberg to get his insight into our ideas and what would be more plausible for our project. He told us some more details about the query by humming project and how its poor performance resulted in it not being a product that could go on the market. The act of breaking down music into separate lines is actually quite difficult since it’s hard to determine instrument lines and such. He mentioned F0 estimation which tries to find the primary note at each instance, which is essentially melody tracking, but also has mixed results. His suggestions have shifted our path more towards looking into using similarity matrices to match the songs. Similarity matrices essentially plot one song against another, and searching for diagonals locates the places where the two songs match up.

The similarity matrix idea also helps to play into the data visualization aspect of our project. Matrices are inherently visual so if we end up using this technique then the work that has been done by the matching algorithm through the matrix can be shown.

A point brought up during our weekly meeting with Professor Savvides and the TAs was that including a data visualization portion would help with debugging as well. I read this article which addresses some of the existing software that people use for similar things, such as Tensorflow Graph Visualizer. We will probably end up using those softwares, or at the very least employing techniques from them.

Unfortunately I have technically fallen behind schedule. I did not anticipate how much more research and planning we would have to do before moving on to other tasks, such as designing the data format. However, I have furthered my understanding of the problem at hand sooner rather than later, so I have a better idea of what will work now rather than having to turn back to try a different solution too late.

For next week, I would like to have a more concrete plan of how we are going to go about implementing both the audio analysis and the matching algorithm and explore how that will interact with the data visualization aspect of the project.