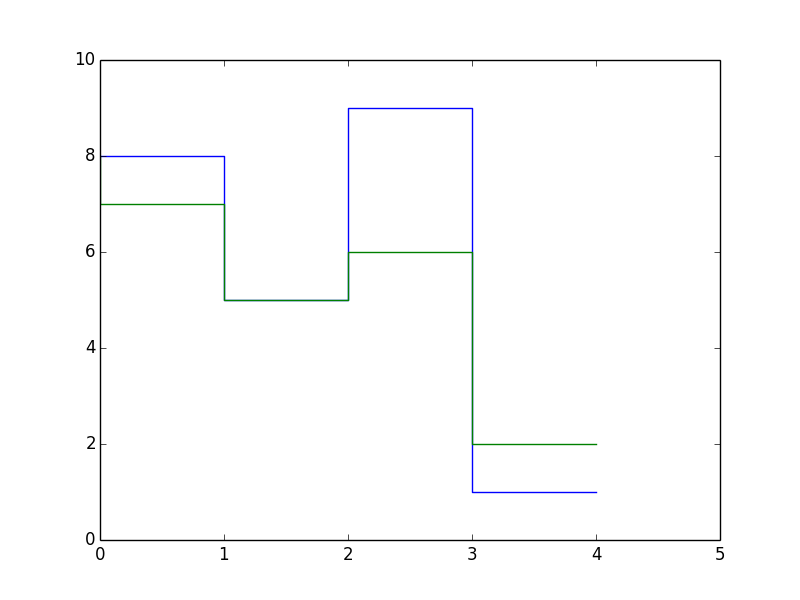
This week I developed a very basic dummy implementation of how the melodic contour analysis part of data visualization will be displayed. An example is shown in the figure below. The actual graphic would show the musical notes on the side (per the example we put in our design document, also attached below), but you can see in this graphic how the melody matches at some points and deviates at others.

I am also (in conjunction with Anja) looking at C libraries for processing audio so that I can try filtering background noise out of the sung input.
As mentioned in a previous status report, there are cool ways of visualizing at the convolution and filter layers in a CNN. Now that I have seen the background on it, I will be looking more into how to actually implement it.
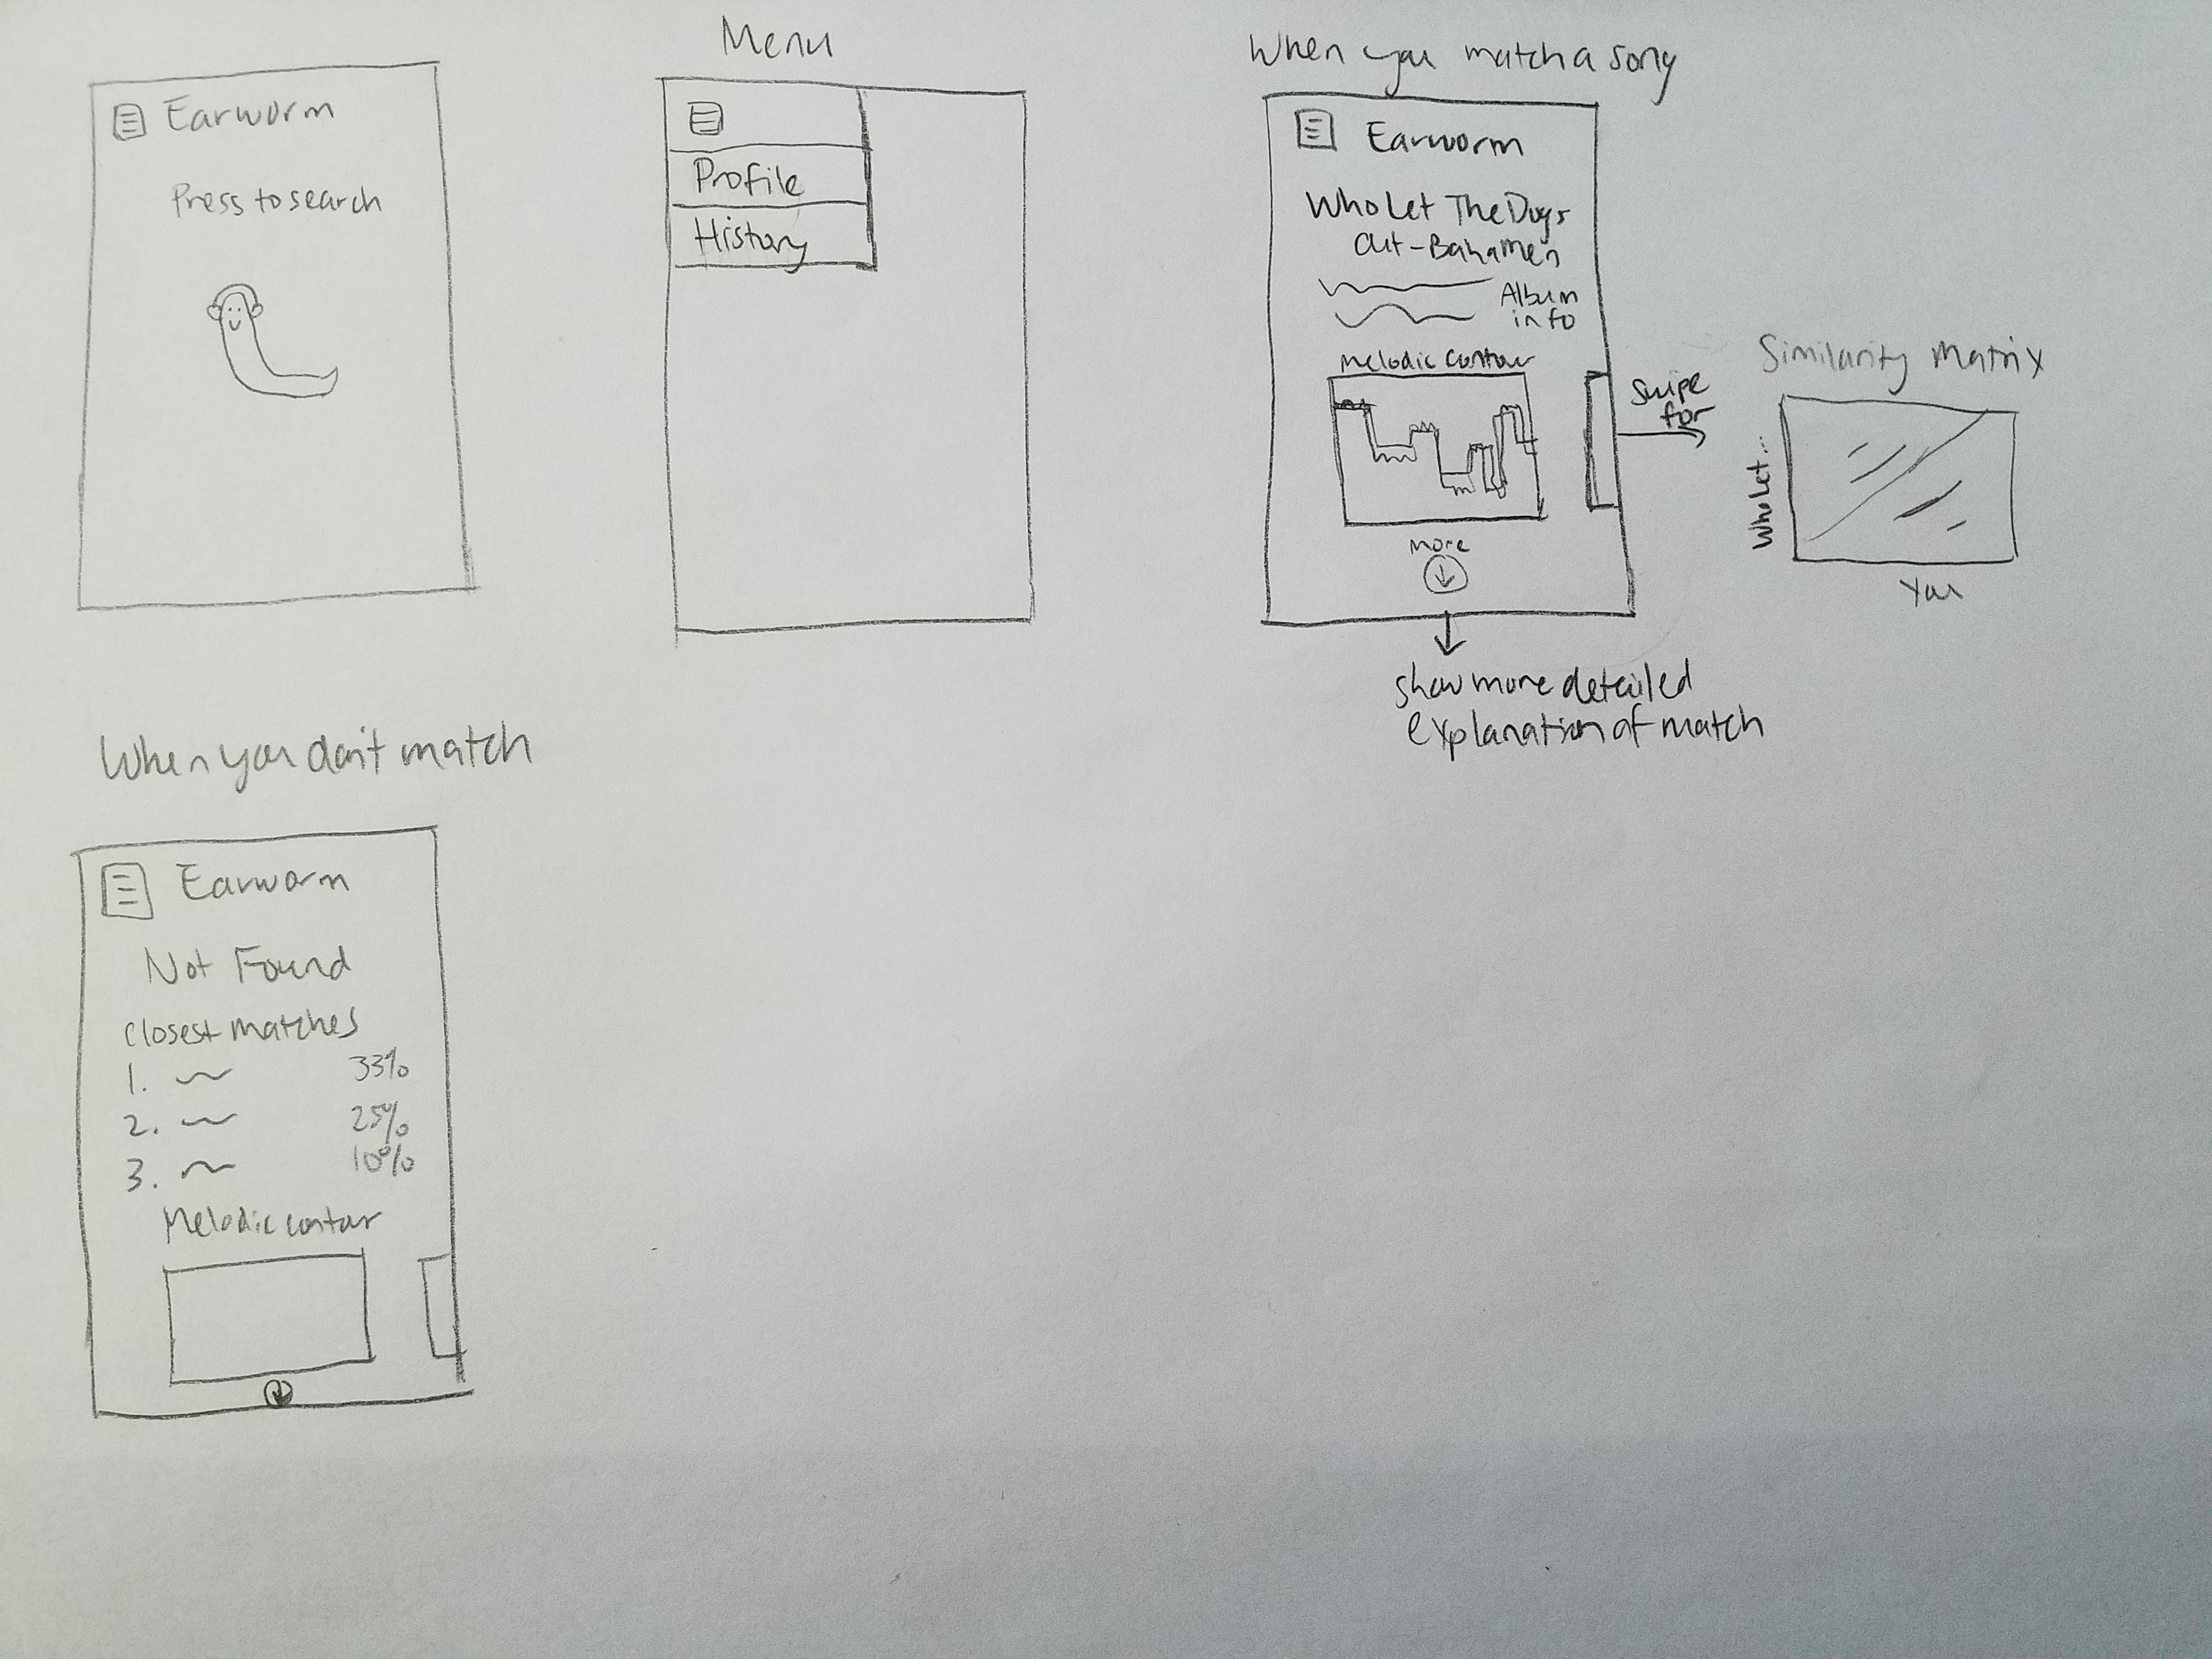
Finally, I began UI design for the final app – sketches shown below.