Final Presentation Slides
Status Report: Nolan
The neural network is trained on our database of 63 songs (these are sort of arbitrarily chosen, I went on a youtubeToWav converter downloading spree).
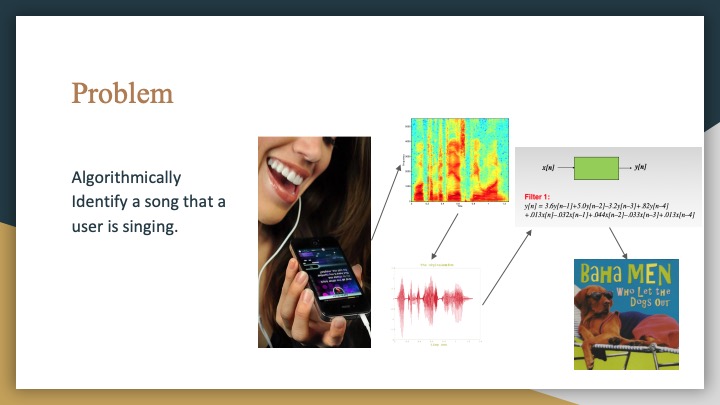
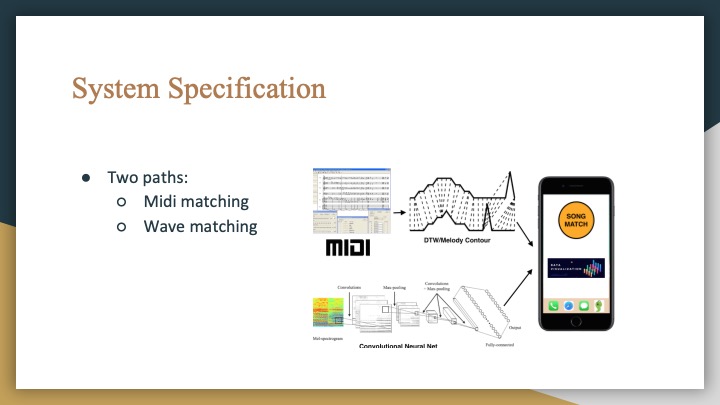
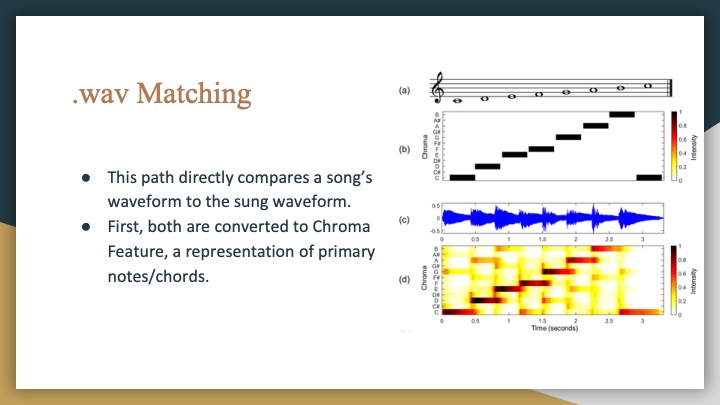
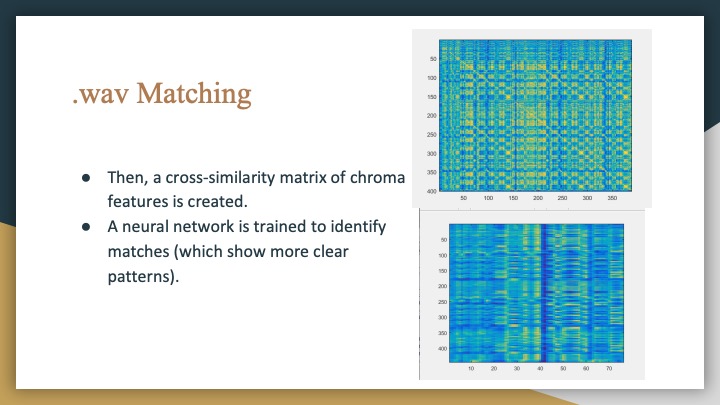
To reiterate, the model is as follows: A song will be recorded in .wav format, then converted into a chroma feature (actually, a CENS format, which includes some more normalization and smoothing). This CENS is used to produce a cross-similarity matrix with every song in the model’s CENS. These matrices are all classified (the classifier outputs the probability that a matrix represents a match), and the highest-probability-of-match songs are ranked. Currently, the network’s mean squared error is about 1.72%.
Before the demo, I’m cleaning up the integration and making sure that everything can smoothly connect with the visualization webapp and with anja’s dynamic time warping. Since my neural network is in python/keras and my preprocessing is in MATLAB, I’m using MATLAB’s engine for python to integrate those.
Anja Status Report #11 Last one
The pitch contours are looking fairly good. I cleaned them further by trying to remove spurious troughs in the contour. I did this by taking max-series and then removing spurious peaks.
For improvement, I have been fine tuning the analysis. I have considered different options instead of just DTW:
For every alignment that looks really good, the autocorrelation would be completely symmetric, since the stretched function would look just like the one matched against it. So if I could instead get a measure of symmetry, or rather skewness, of the autocorrelation, this would show that for whatever amount of stretching needed (even if it were a lot), if it were very closely aligned then that would be the optimal match.
Besides the analysis, I have considered the complexity as well. Currently it matches within about 3 minutes for a 5 songs database, so this will need to be sped up completely. I am going to play around with the hop size for the DTW windowing. I have already bucketized the database contours and the query contours by about 0.1%, which seems to be the highest that still preserves information.
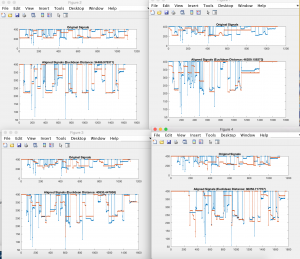
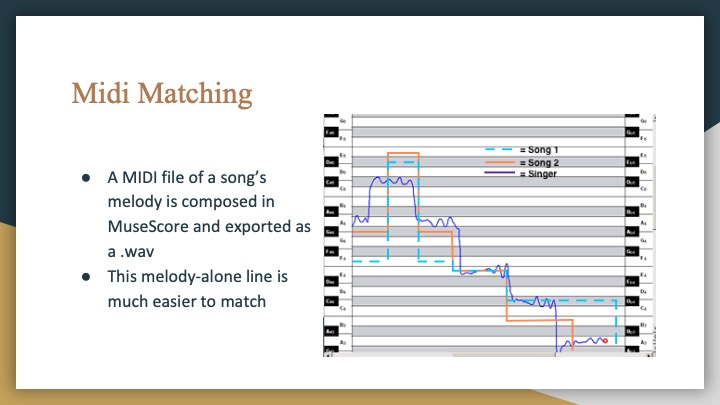
pictured above are some alignment plots. The blue is the sung query, and the contour of a song in the database at a segment in the song range that seemed to be the closest to what was sung.
Overall, I’m still going to be bumping up accuracy and complexity until the demo.
Wenting: The Final Status Report
I’ve made a ton of progress since last week. As mentioned last week, I was looking for a library to capture audio and had to do a lot of digging to find one to save .wavs, which is the audio file format being used for the backend processing. I’ve never worked with React before this so it has been a big learning experience.
I’ve gotten almost all the features for the web app implemented. The user can record a clip that is then posted to a Flask server and saved. The file is then passed to Matlab for processing and the results (melodic contours, matched song titles) returned back to the frontend for rendering the visual results. My last task is to get the results to display at the correct time. I have put together the design for displaying and just need to have it trigger at the right time (i.e. when the processing is complete).
Public demo is in 2 days so all I can say is it’ll be done by then. 🙂
Anja Status Report #10
This week I worked on improving pitch detection. I am going with Power Spectral Density function and peak detection within that. I have cleaned the signal up a little more, since I noticed many issues with spurious peaks and also the recording picking up harmonics.
I have passed the signal through a human vocal range band pass filter.
I have also thresholded based on amplitudes.
I had a meeting with Professor Stern’s team to talk about potentially improving it further. Their team has an approach that uses autocorrelation functions and then a histogram of peak differences to pick the best peaks. He suggested modifying which peaks I select.
So I still need to smooth out the signal, this job has proven more difficult than imagined. I will attempt to do more with better peak selection from the PSD plot.
All I have left to do is to improve the signal smoothing like such and to collect more statistics on the heuristics. We will make our final presentation very soon and also the poster for the poster session. Finally, I will place my scripts in my public AFS space so that our website can interface with it and query it.
I seem to be in a tight spot, but am hopeful things will be on time.
Nolan: Status Report 10
I’ve got the pre-processing and creation of cross-similarity matrices down to a point where I feel happy with it. This week I created a set of .wav files of songs to train a model off of. I have 66 songs selected, so with two team members singing each song, there will be almost 9000 cross-similarity matrices to train off of: 132 matches and several thousand mismatches. This week I will be training the model.
Team Status Report 10
We all made significant progress this week with the challenges mentioned last week and are pushing forward to the end. While we are still concerned that our system will be slow or not work very well, we are hopeful for decent results.
We are still lagging a bit behind but obviously the clock is ticking, so we are doing our best to reach the optimal state possible come public demo.
Wenting: Status Report 10
This week I did more work on the app in both the visual design, adding pages, and connecting to the backend. My challenge this week was finding an audio recording library to use on the web app and integrating it with what I’ve already done. I also need work on how to trigger Matlab to run when the audio has been captured and then return the results back to the front end.
I am currently behind and have a lot to do before the final demo. I know the resources that I can use and reach out to for help though, so I am confident in my ability to get it done.
Wenting: Status Report 9
This week I worked on putting together the web app and refining visualizations. I currently plan on having the following visualizations:
For a matched song
- A “percent” representing how close the match was based on a weighted score from melody contour analysis and the similarity matrix
- The sung input plotted on top of the original song
- Histogram showing the distribution of distances (difference between original and input)
For a non-matched song
- List of top match(es)
- The same visuals as for the matched song but for each song
Possible additional features
- Link to the song on Youtube/Spotify
- A Yes/No button to determine whether Earworm was correct or not (good for feedback?)
As of the coming demo, I will be on track and just need to do further refinement based on feedback and integration.