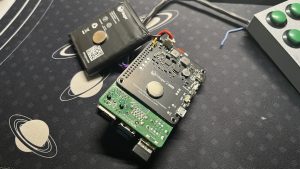
This week:
For the function to migitate the handshaking of users, based on the Gaussian filter model I mentioned last time that help generate a diffused image by getting weighted average value around a certain point, I would like to generate the ouput by a weighted average of a series of x, y, z readings from gyroscope.
Suppose we use x_n, y_n, z_n for note the x, y, z reading from the gyroscope at a certain time, and a_n, b_n, c_n for their weight. Then the output degree should be a result of combination of x, y, z reading from several previous readings that doesn’t differ very much as follows:

The target of tunning should be determining the value of n that indicates the number of previous readings that we want to use, and the a, b, c values to determine the weight of readings from x, y, z and based on the time of the reading (which means newer readings will have higher weight).
We will then talk about the logistic growth function that maps the gyroscope reading to output to the game, I have tried several possible combination of parameters. The function can be written as:

L means the range of our data, here since our degree output should be 0-180 degrees in each direction, so for the f(x) of each direction we define L=180.
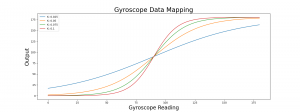
k means the logistic growth rate, or we say the steepness of the curve, finding the correct value of k should be our target when tunning the steering wheel.
x_0 means the x value of the sigmoid midpoint. Here $x_0$ = 90 since we want the range to be 0 to 180.
I have tried several k values for this function to generate the mock output graph. Determining which k value to choose will depend on our testing result after the hardware is built. The graph is shown below:
The workflow of the gyroscope system should be defined as first reading the raw data from gyroscope and store them in a first in first out list of n readings. Then use the n readings to generate the weighted output and send the result to the logistic function to map the reading to the final output.
