This week was all about collecting experimental data for Udit’s simulator.
At the beginning of the week, I connected the Decawave TAG to the Raspberry Pi and logged timestamp data from the chip on the Raspberry Pi. I also wrote a Python script to parse logged data from the tag and graph the periodicity between its transmission pulses:
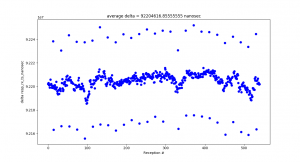
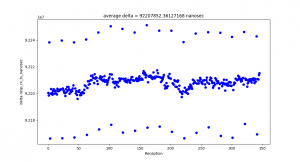
I observed a consistent pattern of timestamp outliers. Additionally, even though the tag was programmed to only pulse once every 100 million nanoseconds, the average time between pulse receptions was 92 million nanoseconds. At first I thought the issue might be on the anchor’s end. However, when I logged the transmission times directly from the tag, I observed nearly identical results:
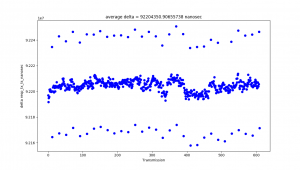
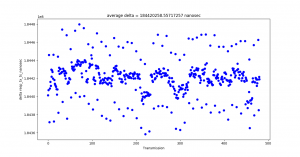
I am not yet sure what the source of these problems are.
One source may be the Decawave’s API, which zeros out the low 8 bits of its internal clock automatically to store the timestamp in a 32-bit format. This means that the time counter is only accurate to within 8 nanoseconds of the true transmission time. This problem may be compounded by the Decawave clock’s low rollover time — the system clock is only 2^40 bits long, and each bit of Decawave time is about 15.65 picoseconds of real time. This means that the clock zeros itself out every 17.2 seconds
To investigate further, I wrote a script to read the tag’s data in real-time and insert the Raspberry Pi’s own system clock time into the log to compare. However, this script does not work yet; a bug that I think is caused by non-atomic read/write operations means that the script prints the Pi’s system clock into the middle of the Decawave log, scrambling the log results and making it impossible to parse consistently.
In the second half of the week, I tried modifying an example TDOA tag code provided by Decawave to communicate with the anchor code I had written, but had no success.
This is a bit of a switch-up on the Gantt chart. Originally, I was going to have the Raspberry Pi forward timestamp data to the multilateration server and test out the program:
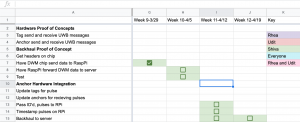
However, we shifted gears to accommodate our midsemester demo. Udit implemented an ideal multilateration algorithm to show for the demo, which did not need that info. So I worked on passing the tag and anchor IDs to the Pi and timestamping the pulses directly on the Pi.
Next week, I will continue investigating these problems, fixing the bugs in the RPi timestamp program, and working with Udit to pass realistic timestamp data to his multilateration program. Since I got some of next week’s work done this week, I am still on schedule.
