Week 6 Team Report

What are the most significant risks that could jeopardize the success of the project?
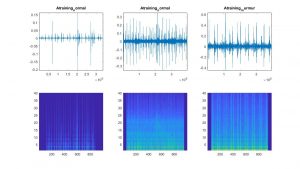
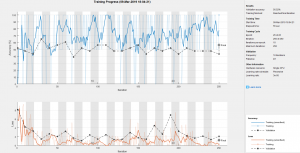
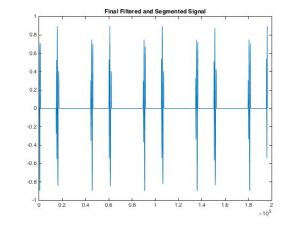
The most significant risk in our progress so far is still the CNN. Although we’ve made significant progress, it is still not yet at the 85% goal we set early on. We are hopeful that our improved preprocessing of the data will help improve results because the spectograms were very varied depending on the input length.
How are these risks being managed? What contingency plans are ready?
We have other methods such as LTSM to test in case our current methods do not work well.
Were any changes made to the existing design of the system (requirements, block diagram, system spec, etc)? Why was this change necessary, what costs does the change incur, and how will these costs be mitigated going forward?
No changes made this week.
Provide an updated schedule if changes have occurred.
No changes made this week.

Ryan Lee – Week 6 Status Report

I once again worked on improving the accuracy of my CNN network this week. I expanded the training set to now include training set A and B versus A from last week. On initial testing, the results actually decreased to a consistent 71% from 79% from last week. When analyzing the testing data more thoroughly, the data varies from 5 seconds to 120 seconds which is a huge variation. This affects the spectograms because when it is computed, I have to specify a segment duration since it compares frequency to time.  If the sounds are not as long as the segment duration that portions of the spectogram will be blank. Therefore to improve the data, Eri and I decided to shorten all the sound files to 5 seconds long and test with these results before researching a more complicated LTSM method. We are also planning on using Eri’s Shannon Expansion method to reduce noise in the samples. Upon testing her code, we noticed that some samples weren’t normalized to be centered around the 0-axis, which messed with the calculations of the shannon expansion. Therefore, we also worked on normalizing the data to now be centered around 0. Tests have to be done tomorrow to see if any improvements to accuracy will happen before our mid-semester presentations.

We will be on schedule once we test the newly processed data.

Next week deliverables will depend on the results we get this week, but if improvements have to be made to the preprocessing, we will try and use LTSM’s instead of just segmenting to a strict 5 seconds.

Eri: Week 6 Journal

What did you personally accomplish this week on the project? Give files or photos that demonstrate your progress. Prove to the reader that you put sufficient effort into the project over the course of the week (12+ hours).

One problem we ran into this week was that we used a different dataset from Physionet so we could have more instances to train on. However, this meant that the heart sound files were different lengths, ranging from 5 seconds to 31 seconds. Also there were files that had heart sounds that did not have a central value of zero. To fix this, I cut all the files down to five seconds and normalized all the files so they had a central value of zero, with minimal noise. Ryan then trained the new files to get a higher percentage accuracy than last week.

This week we also used our actual stethoscope to collect Ari’s heart sound, and after putting it through my normalizing and denoising algorithm, it produced the final heart sound signal shown below.

Finally I updated my Gantt chart to reflect on Ryan and me working together from now on.

Is your progress on schedule or behind? If you are behind, what actions will be taken to catch up to the project schedule?

My progress is on schedule this week

What deliverables do you hope to complete in the next week?

In the following week we hope to be able to collect heart sounds from our smart stethoscope and test whether it is normal or abnormal using our trained algorithm and get a final analysis. Even if the analysis is incorrect, this is our goal because it is a first step in putting all our different works together.

Week 5 Team Report

What are the most significant risks that could jeopardize the success of the project?
The most significant risk in our progress so far is the CNN not working. We have officially decided to not classify using SVMs anymore and switch to the CNN architecture, so we are investing all our efforts into this method.
How are these risks being managed? What contingency plans are ready?
Since we do not have SVM as a backup method in case CNN does not work, we would have to change our CNN method if the accuracy doesn’t reach the desired accuracy. We will be researching methods of LSTM since the input data from our new data set is varying in time length, so hopefully that will improve our accuracy.
Were any changes made to the existing design of the system (requirements, block diagram, system spec, etc)? Why was this change necessary, what costs does the change incur, and how will these costs be mitigated going forward?
We have officially decided against using SVM, so we are now only using the block diagram with the CNN architecture.
Provide an updated schedule if changes have occurred.
Eri is now working on CNN with Ryan instead of working with SVMs now.

Eri: Week 5 Journal

  1. What did you personally accomplish this week on the project? Give files or photos that demonstrate your progress. Prove to the reader that you put sufficient effort into the project over the course of the week (12+ hours).
  • I started working on the SVM, but using the features I listed below that I extracted from the heartsound signal this week I was only able to get the accuracy up to 60%, which isn’t that great since it is only classifying between abnormal and normal.
    • mean value
    • median value
    • mean absolute deviation
    • 25th/75th percentile value
    • interquartile range
    • skewness value
    • Kurtosis value
    • spectral/shannon entropy
    • max frequency/max value/max ratio
    • systole/diastole time
  • Through research I learned I should also extract the Mel-frequency cepstral coefficients, but since our deadline is approaching and I don’t know anything about Mel-frequency cepstral coefficients, Ryan and I have decided to scrap the SVM approach and focus on the CNN. This is because he already managed to get the accuracy percentage to nearly 80%, which is close to the 85% we are aiming for.
  1. Is your progress on schedule or behind? If you are behind, what actions will be taken to catch up to the project schedule?
    My progress is on schedule this week. We were aiming to decide between CNN and SVM by the end of this week, and we successfully did this.
  2. What deliverables do you hope to complete in the next week?
    • I will fix my Gantt chart to match that of Ryan’s since we will work together on the CNN from now on. Next week we hope improve the initialization of the CNN and test it on the full Physionet dataset.

Ryan Lee – Week 5 Status Report

For this week, I worked on improving the accuracy of my CNN by training it on more data. I found a dataset through PhysioNet/CinC Challenge 2016’s dataset (https://physionet.org/physiobank/database/challenge/2016/), which contains a total of 3,126 heart sound recordings. Previously, there were only a little over a hundred instances of data in my previous dataset, I manually preprocessed the data to split the training/validation/testing set, so this time I had to code python scripts to do this for me since I am handling a larger dataset. I first tested on the training-a folder which contains 409 audio files, so the training/validation/testing set each contains around 136 sounds, which is a huge increase from the prior 60. When training my CNN on this data now, it consistently produced an accuracy of 79% accuracy which is a huge improvement and close to our goal of 85%. Although almost always around 79% accuracy, since the indices are being randomized at initialization, the accuracies reach 29% at times, which definitely has to be fixed. I have to improve the initialization of my CNN to prevent this issue. I also plan on testing it on the full dataset in the coming week. The reason I test on only the A set is because the description wasn’t very clear on the differences between the sets, so I’m not very sure if the audio between set A and set B were taken differently. This is something I definitely have to test with to increase the amount of data I can train my network with. I am currently behind schedule because I had to switch datasets midway through, but I should be on schedule next week once I finish training my network on the entire dataset.

Ari’s Week 5 Status Report

This week, I began developing the entire structure of our integration. I planned to develop a python program that will run a script to live view the heart beat waveform. I also was able to test running our mat lab script via python and will be loading the entire script onto a raspberry pi to view the live heartbeat and analyze it.

Ryan – Week 4 Status Report

For this week, I began classifying the heart sound training data using a CNN. I researched that CNN’s aren’t very optimal to use for audio files so instead I am taking the spectograms of the data and then training the network on the images of spectograms rather than originally planned as the audio files. I also changed the architecture of the network to now include five convolutional layers that are each followed by a normalization and ReLU layer. The new architecture for my CNN in Matlab code is:

  1. convolution2dLayer
  2. batchNormalizationLayer
  3. reluLayer
  4. maxPooling2dLayer
  5. convolution2dLayer
  6. batchNormalizationLayer
  7. reluLayer
  8. maxPooling2dLayer
  9. convolution2dLayer
  10. batchNormalizationLayer
  11. reluLayer
  12. maxPooling2dLayer
  13. convolution2dLayer
  14. batchNormalizationLayer
  15. reluLayer
  16. convolution2dLayer
  17. batchNormalizationLayer
  18. reluLayer
  19. maxPooling2dLayer
  20. dropoutLayer
  21. fullyConnectedLayer
  22. softmaxLayer
  23. weightedClassificationLayer

Here is also a visualization of example spectograms of both normal and abnormal heart sounds from the training data:

I then ran the CNN and it achieved an accuracy of 56.52% in 55 seconds to run. I ran it with 25 epochs.

Here is the graph of the training session:

Improvements have to be made to the preprocessing of the data as well as finding a more optimal architecture for this data in the next week.

I am currently on schedule for the week.

Week 4 Team Status

What are the most significant risks that could jeopardize the success of the project?
Since we are all on spring break, our most significant risk this week is lack of communication. So far we have been working together in person to make sure we are all one the same page, and this has made our progress a lot more efficient.
How are these risks being managed? What contingency plans are ready?
We will text/facetime each other if any significant changes or progress has been made to make sure we are all up to date on where we are in the project.
Were any changes made to the existing design of the system (requirements, block diagram, system spec, etc)? Why was this change necessary, what costs does the change incur, and how will these costs be mitigated going forward?
We did not make any changes to the requirements/block diagram/system spec this week.
Provide an updated schedule if changes have occurred.
There have been no changes.

Eri: Journal Week 4

  1. What did you personally accomplish this week on the project? Give files or photos that demonstrate your progress. Prove to the reader that you put sufficient effort into the project over the course of the week (12+ hours).
  • This week I was able to find five full ‘lub’ ‘dub’ beats. It did not work on all of our training algorithm at first, because it seems to not correctly determine all the S1 and S2 because the findpeak algorithm on matlab is not accurate enough
  • To fix this I found the average diastole distance and checked that the frequency of the first s1 peak is smaller than the first s2 peak to correctly determine five full ‘lub’ ‘dubs’
  • One problem I found this week was that some of the signal we disregarded as ‘noise’ using my algorithm could be useful in helping to classifying a murmur, since many heart sounds with murmurs seem to have low amplitude signals directly following an S1 or S2 beat.
  • Feature extraction for SVM: I have researched and decided to use the following features for my SVM:

Time Domain
• mean diastole period (time between S2 and the next S1)
• Mean of the ratio of duration of systole to the RR interval – I don’t know what RR interval is yet, but I will research this next week.
• Maximum mean value between S1 and S2
• Mean of the S2 amplitude peaks.
• Mean of the S1 amplitude peaks.

Frequency-domain

• Average ratio of the power of each diastolic segment in the 100-300Hz frequency band to the power in the 200-400Hz frequency band.
• Mean power of each diastolic segment in the 150-350Hz frequency band
• Mean power of each diastolic segment in the 200-400Hz frequency band

  1. Is your progress on schedule or behind? If you are behind, what actions will be taken to catch up to the project schedule?
    My progress is on schedule this week.
  2. What deliverables do you hope to complete in the next week?
    • Since I am on spring break right now I don’t think I will get much done this week. However, I will start work on extracting the features I mentioned above from the dataset.