I was sick this week and missed Wednesday’s class, as well as some targets our team had set between ourselves for the design proposal. This caused us to be a little rushed at the end of the week before slides and this report were due. I did not communicate this well enough to my team, so one thing I need to improve is communicating delays earlier instead of waiting until a deadline has passed.
My planned work also changed after our discussion with Prof. Byron Yu. He brought up several valid concerns regarding what were controlled and confounding variables in the experimentations we planned to build our model around. We realized that public SSVEP datasets were collected under specific experimental conditions that do not necessarily match our electrodes, hardware, display, or environment. Instead of relying on those results to validate our system, I developed an initial plan for collecting our own data as written below:
- Keep electrode placement, reference, viewing distance, screen brightness, lighting, sampling rate, and trial duration consistent. Here are some preliminary numbers. For our initial testing, we will use O1, Oz, O2, and POz over the visual cortex with the same reference and bias placement (earlobes) for every session. The display will be fixed at 60 Hz, approximately 60 cm from the user, with constant brightness and room lighting. EEG will be sampled at 250 Samples/sec and processed over 2–3 second windows. Each command will initially be tested over 30 randomized trials, split into blocks of 10 with short breaks to reduce fatigue. These values will remain fixed during testing so changes in classification performance can be attributed primarily to the EEG response rather than changes in the experimental setup.
- Use our three stimuli at 8.57, 12, and 15 Hz with the display fixed at 60 Hz. These numbers have changed since before. The reason was that studies showed SSVEP responses are strongest at the stimulus frequency and can also appear at its harmonics, so we wanted frequencies that were sufficiently separated without one being a simple harmonic of another. We also wanted frequencies that our 60 Hz display could reproduce exactly using integer frame periods. Our current set uses 7, 5, and 4 frames per cycle, giving 8.57, 12, and 15 Hz. This keeps all three targets in a commonly used SSVEP frequency range while avoiding direct harmonic overlap between our three fundamental frequencies.
- First test each frequency individually and verify that it appears in the measured EEG.
- Then collect randomized YES/NO/HELP trials in blocks with rest periods.
Finally, I completed a working stimulus renderer for YES/NO/HELP. It generates the three frame-locked frequencies, checks the display refresh rate (so it was not hardcoded to my Macbook, for example), logs the frame timing, and gives us an interface for both the presentation and later data collection.
Below is a screenshot of the interface:
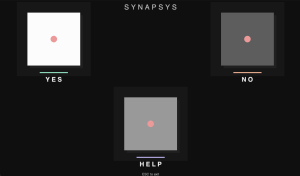
AI, specifically Claude Opus, was used in its creation, as well as setting up the initial repo with README, pyproject, various pytests, and general documentation.
Schedule
I am behind schedule, in this course and my others, due to being sick and because the experimental approach changed this week. I completed my other course’s labs early so I can dedicate more time to the project on Tuesday and Thursday’s dedicated lab time next week to catch up.
Deliverables for Next Week
I plan to implement and test the initial CCA classifier, help write the design report, and define quantitative requirements for classification/rejection and PCB testing. I will also finish documenting and testing the stimulus renderer so it is ready for our eventual EEG experiments. As a team, we plan to finish the schematic/design review, continue PCB layout and component choices, and move toward the first PCB fabrication order.