Yuchen’s Status Report 3/15/2024

Accomplishments This Week:

  • Finished the overall frontend of the website
  • Added card-style dashboard page for displaying statistics, forecasting, etc
  • Added profile, login, and upload file pages

Challenges Encountered:

  • When integrating the parser with the Django web app, there was something incompatible with Windows, and turns out that the parser needs to be set up in a Linux environment.

Next Steps:

  • Initialize AWS EC2 Ubuntu instance for deploying the parser
  • Integrate the updated frontend and the parser code into current Django web app
  • Start to integrate ML models into web app

Carter Weaver’s Status Report for 3/16/24

This week I worked on the actual development of my forecasting tools. Firstly, I was finally able to access a large and reliable enough dataset for load measurements from a selection of residential homes in the UK. Another data collection decision I made was to purchase a bulk download of historical weather data from 2013-2023 off of OpenWeatherMap for training purposes. The download consists of three datasets for three locations relevant to our solar, load, and wind datasets: Pittsburgh (US), Loughborough (UK), and Yalova (Turkey). 

As for code that I contributed to our repository, I started with some data preprocessing by extracting cyclical information from DateTime objects, such as days of the week, as features for our model to make more informed predictions. With the load data and supplementary weather data downloaded, I was able to finish all of my linear regression baseline models, all of which showed very bad results as expected.

Finally, I started experimenting with fitting our wind data to a simple lstm, which I got from Tensorflow’s Keras API. This is already exhibiting better results than our basline model, which is encouraging. Next week, I hope to have a simple lstm working for all of our datasets and then begin integrating the models with our webapp and optimization tools.

Alby’s Status Report for Mar 15

Accomplishments This Week:

  • Added battery equality constraint dual variable feedback into multi-period solver, verified correctly updated across epochs through a “folded in” backward pass.

Challenges Encountered:

  • Battery lambda gradient is slow to converge due to large step between epochs

Next Steps:

  • Rewrite battery Lb and Bt equation stamps to explicitly define all terms and avoid confusion from cancelled out terms
  • Create a GLD file with specifically labeled negative PQ loads for Solar and Wind generators.
  • Add to Multi.py a method to modify renewable PQ loads at each time step based on load factors.

Team Status Report for 3/9/24

Risks

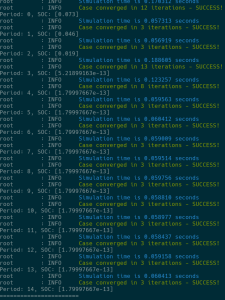
  • There is still uncertainty about the reliability of weather forecasts and the consistency of OPF convergence so backup/default outputs will be implemented to keep our web app simulation running smoothly.

System Changes

  • Redefined error goals for forecasting to NRMSE < 20% and NRMSE <15% to more closely align with previous literature.

Schedule Changes

  • None.

Please write a paragraph or two describing how the product solution you are designing will meet a specified need…

Part A. Written by Carter

Our tool has the potential to impact energy solutions worldwide. Electricity grids are globally utilized and microgrid technology as a more reliable and sustainable method of energy distribution is growing rapidly all over the world. Therefore, the tools necessary to control and predict for these microgrids is needed everywhere. In addition, weather patterns and energy availability varies greatly between different countries and regions of the world, so tools like Sugar-DB that can adapt to those changes and make predictions based on local data are needed globally.

Part B. Written by Carter

The need for reliable and sustainable energy is shared across all cultures in our modern, globalized society. Despite disagreements between different groups about the threat of climate change and the degree to which fossil fuels are culpable, the increased accessibility and economic efficiency of renewable energy can only benefit the people and the planet.

Part C. Written by Carter

A main goal in creating our simulation tool is to make renewable energy generation easier to predict and optimize around, given changing weather conditions and energy demand. This will hopefully encourage greater integration of renewable energy sources in the microgrids we already have, as well as the creation of future microgrids supported by renewable energy as well. Scientific evidence suggests that electrifying our grids and relying more on sustainable energy rather than fossil fuels will slow down the effects of climate change and potentially save natural resources that are at risk of rising sea levels and unpredictable weather patterns. Thus, our tool is designed to promote earth-friendly energy management which has the power to save lives and save the earth from climate change.

Carter’s Status Report for 3/9/24

The week before we left for spring break, my work for Sugar-DB focused mostly on our design report. As the designated project manager that week, I took on a lead role in the development of the report. This meant that, along with the subsections dedicated only to our forecasting design, I also wrote many of the general sections which applied to our entire project and handled most of the formatting of the document.

In the process of putting together this design report, I looked deeper into previous research and even found new sources that helped me narrow down our goals for the future and change some of our assumptions for the forecasting models. As a result of this research, I plan to focus my efforts after spring break ends on programming a working LSTM model, that can be fine-tuned and generalized to all three data pools (wind, solar, load). I plan to start with wind modeling, given the relative simplicity of the dataset.

Yuchen’s Status Report 03.07.2024

Accomplishments This Week:

  • Users can now specify a zip code and upload customized GridLAB-D files
  • Finished most parts of power flow and dynamic load visualizations. Each node in the microgrid will display information such as the node type, scale, power flow direction, distance, and node paths.

Challenges Encountered:

  • There were some issues with setting up the parser so the next step is to integrate it with the parser to finish the overall pipeline. It’s a minor issue and will be fixed next time we meet.

Next Steps:

  • Moving forward, we aim to fix the parser integration, finalize the pipeline, and ensure its functionality with various file types and sizes.
  • Meet with team members and discuss user registration and logins necessary for our apps, figuring out whether we should store users’ inputs into the database or run everything locally based on our needs.

Alby’s Status Report for Feb 23

Accomplishments:

  • Updated Multiperiod class to extract the SOC variable and related constraint dual variables during each iteration. I ran for 15 periods and battery SOC decreased linearly as expected until depletion.
  • With latest battery model, SUGAR3 converges with a depleted battery SOC.
  • Added previous solution initialization to the multiperiod class, which decreases solve times by 3X for each period after the initial one.

Progress Reflection:

  • Multi-period is developing smoothly in cooperation with the Pileggi group battery model. I am happy with my progress, but I need to understand DDP better and how the algorithm converges across multiple epochs

Next Weeks Goals:

  • Understand DDP, talk with Aayush
  • Add renewable generation as negative PQ loads within the GLD file with a nominal power modified by a specific capacity factor each period.
  • Validate single period solutions using a Grid-lab D testcase for 2bus network – talk with Elizabeth.

Convergence!

Yuchen’s Status Report for 2.24.2024

This week, I’m focusing on learning how to utilize Vis.js to manage our datasets and visualize the power flow and dynamic loads within the microgrid. Tackling the microgrid’s visualization is the most complex aspect of the web application, prompting me to prioritize it. Although I explored various open-source projects related to microgrid visualization, I found that integrating them poses significant challenges, and they lack the interactive capabilities we desire. Therefore I’ve switched my plan to building a new visualizer instead of integrating others.

For inspiration, I’ve explored several websites, including https://www.renewables.ninja/, which offers users the flexibility to adjust variables such as wind power, photovoltaics, weather conditions, and even select specific locations on a map. Currently, our minimum viable product (MVP) only accommodates location inputs. However, incorporating these additional customization options would be an excellent stretch goal for our project.

Unfortunately, my productivity dropped this week due to illness and the concurrent scheduling of my midterms. However, we had anticipated potential delays by incorporating some slack time into our schedule, allowing me to recover lost ground efficiently. For next week I’m aiming to finish the visualization of the microgrid before spring break.

Team Status Report for 2/24/24

This week, we were able to speed up convergence times for our optimization, Outputs baseline metrics for our renewable energy forecasting, and further design our web app visualizations.

Risks

  • Our chosen Weather API was revealed to have more restrictive paywalls than originally anticipated, but other options are proving to be useful
  • Optimization is currently converging but could not in the future due to updates to SUGAR

System Changes

  • Forecasting models will not be able to use real world feedback from the simulation and so will rely only on weather forecast data.

Schedule Changes

  • None

Carter Weaver’s Status Report for 2/24/24

This week I spent time revising my methodology for accessing and providing a baseline model for each of our training data sets (load, wind generation, and solar radiation).

In response to learning more about the SUGAR simulation tool we’re using, I decided to do away with the persistence algorithm we were previously using as a baseline algorithm, since recently observed power generation/demand will not be available to our models as a part of the simulation output. Instead, I decided to fit a linear regression model using weather and time as features and power/radiation/demand as the target variable. So far I’ve gathered Relative-MSE scores of 0.59 and 0.41 for our solar and wind data respectively, indicating that we have far to go in terms of improving our predictions. With these results and the results I will soon have for our load data, I am reasonably on pace for my forecasting goals.

Next week, I plan to generate baseline metrics for our load data with a linear regression model as well. Also, as the designated project manager for these two weeks before spring break, I will be devoting much of my time to developing our design report.