Team Status Report 04/27/2024

This week, the team made significant progress on both the web app and machine learning model integration. We addressed several backend issues, including package dependencies and storage for user-uploaded files, and resolved integration challenges. Enhancements to the microgrid visualizer now include a slider for hourly predictions and expanded input fields for user uploads. Despite these advancements, issues with the parser persist and will require further attention.

On the machine learning front, efforts focused on fully integrating forecasting models and enhancing the web app’s interactivity and design. New demo features, such as preset scenarios for different weather conditions and holidays, are being developed to showcase the capabilities of our tool in various environments.

Moving forward, the team will continue refining the front and backend, conduct extensive testing across different browsers and devices, and prepare materials such as a poster, video, and final report. Additional enhancements will be made to the forecasting statistics tab to incorporate more dynamic visualizations.


List all unit tests and overall system test carried out for experimentation of the system. List any findings and design changes made from your analysis of test results and other data obtained from the experimentation.

  • Unit Tests
    • Web Application:
      • Test to ensure all forms on the web application validate input correctly and handle errors gracefully.
      • Test the file upload functionality to ensure only the correct file types and sizes are accepted.
    • Optimizer:
      • Test the optimizer with various input ranges to ensure it handles all expected inputs without errors.
      • Test specific algorithms within the optimizer to verify that they return expected results for given inputs.
    • Machine Learning Model:
      • Test the preprocessing pipeline to ensure that data is cleaned and transformed correctly.
      • Test the training process to ensure the model fits without errors and handles overfitting.
  • System Tests
    • Integration Testing:
      • Test the complete flow of data from the web app through the optimizer to the ML model to ensure that data passes through the system correctly and triggers the appropriate actions.
      • Test integration with API to ensure that the system interacts with them as expected.
    • End-to-End Testing:
      • Simulate complete user scenarios from end to end, including logging in, uploading a file, receiving optimization and model predictions, and logging out.
  • Change:
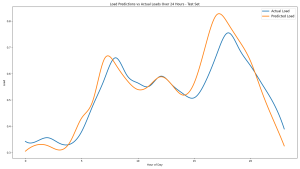
    • To enhance the system’s performance and user experience, several key improvements were made based on testing feedback. The optimizer’s algorithms were refined and additional checks were implemented to ensure robustness. User feedback indicated that the file upload interface was confusing, prompting a redesign to improve usability and provide clearer instructions. Additionally, the machine learning model’s variable accuracy was addressed by adopting a more dynamic training approach to better adapt to data fluctuations throughout the day. Finally, to handle increased user demand and prevent delays, third-party API interactions were optimized and service plans were upgraded as needed.

Yuchen’s Report for 04/27/2024

Accomplishments This Week:

  • Fixed some previous problems such as package dependencies,  backend storage for user input files, etc
  • Solved some integration issues we experienced last week
  • Tested the website using more files
  • Optimized microgrid visualizer with slider for hourly prediction
  • Allowed more input fields while user upload

Challenges Encountered:

  • We’ve solved most problems but the parser issue still persist

Next Steps:

  • Keep improving frontend/backend and test more thoroughly with different browsers and devices.

Carter’s Status Report for 4/27/24

This week I had to spend some time debugging issues with fully integrating the forecasting models into our web app. After working on those issues, I’ve started focusing on the web app design and implementation of certain demo features that we want ready for Friday. Currently, the web app lacks dynamic and interactive elements as well as good examples to show the extremes of our tool, so I’m working on creating some preset scenarios that users could choose from. These include scenarios like “hot, sunny day” and “cloudy, windy day” and “christmas” to show how loads, renewable energy generation and the grid optimization are affected by external features.

For next week, I plan to contribute to the poster, video and final report. I’ll also spend some more time working on the front end for the forecasting statistics tab to add any visualizations that might be interesting.

Carter’s Status Report for 4/20/24

I spent this week verifying that our forecasting models are fully performing at the level we expect and are fully integrated into the overall system. In addition, I’ve spent the latter half of the week working on our final presentation, since I will be giving the presentation next week.

For my models, I ended up moving to a simpler architecture (random forest) for all three of my models, which has produced the best results so far. All three of my models are now achieving the goal of NRMSE <20%, including load which was the most difficult dataset to manage. After coding the pipelines for each model so that our web app can call one function to generate predictions for a given location, I also spent some time visualizing trends in our results through graphs with matplotlib, which are useful for verification purposes and to display in our final presentation. I attached an example below for reference, showing the similarity in hourly trends for our loads predictions and actual loads from our test dataset.

Next week, besides giving the final presentation, I will be focused on ensuring our web app interface is completely ready for demo.

Question: As you’ve designed, implemented and debugged your project, what new tools or new knowledge did you find it necessary to learn to be able to accomplish these tasks? What learning strategies did you use to acquire this new knowledge?

I had to learn a significant amount about energy management systems and specifically renewable energy in order to understand how to model them for our project. This mostly consisted of reading through online research papers about renewable energy forecasting to understand the concepts and methods used in the past. I also had to review and learn more about machine learning concepts I had learned in prior classes, which meant looking back at work I’ve done in those classes.

Team Status report for 4/20

Overall progress:

The webapp is showing continued improvement through better visuals and more charts.

The machine learning pipeline is further improved, with increased accuracy for load forecasting using a different ML method.

Optimization is not converging for some specific cases but showing correct behavior for partially charged operation. Validation and testing are still being performed on each period and the multi-period problem.

Significant risks and risk management:

Risk:  Slow convergence of across multiple epochs

Description:  The multi-period DDP algorithm is not converging over multiple periods due to oscillations through the back-propagation of the battery SOC equality constraint lambda.

Severity: The convergence issue means the algorithm takes too long to test effectively on different test cases and is a high-severity issue.

Resolution: To fix the underlying issue, I will analyze the behavior of the DDP using simple testcases and if no immediate solution is found, I will borrow existing known working DDP code.

Alby’s Status Report for 4/20

Accomplishments This Week:

  • Added IO functionality to support multi-period specific testcases.
  • Built a residual visualizer to verify battery constraints met at each period.
  • Added validation function to test generation and load mismatch and calculate line losses.

Challenges Encountered:

  • Multi-period optimizer is converging slowly and showing incorrect behavior due to errors in the DDP process. These oscillations are preventing battery from behaving correctly when fully discharged, but correct behavior is observed during operation when partially charged.

Next Steps:

  • Investigate multi-period convergence across multiple epochs
  • Produce more example grid models to test the webapp

Individual Question:

Because my optimization code is incredibly complex, it became necessary to learn how to properly debug in python. I started using the PDB debugging tool and writing debug functions. One of the most useful debugging methods I learnt was assessing my intermediate results visually through plotting by asking chatgpt to write plotting functions.

Yuchen’s Status Report 04/20/2024

Accomplishments This Week:

  • Resized Instance and set up the remote desktop with Alby
  • Optimize Frontend for the upcoming demo
  • Try different display schemes for microgrid visualization (use icons, colors, scaling, etc.)
  • Solved some integration issues we experienced last week

Challenges Encountered:

  • The parser stores previous information and leads to merged file contents, which is caused by how the parser read/hold information

Next Steps:

  • Test the website using more files
  • Solve the ‘two file problem’ of the parser
  • Add minor functionalities like download forecasting results

Individual Question: Since you’ve designed, implemented and debugged your project, what new tools or new knowledge did you find it necessary to learn to be able to accomplish these tasks? What learning strategies did you use to acquire this new knowledge?

  • Deepened understanding of Django for robust web application development, focusing on its ORM, template system, and class-based views for a scalable project architecture.
  • Enhanced skills in JavaScript, especially AJAX, for asynchronous web requests to improve UI responsiveness and data interaction without reloading web pages.
  • Learned about various performance optimization techniques for both the front-end and back-end. For example, I got hands-on practice with Bootstrap Studio.

I engaged in project-based learning supplemented by online courses and tutorials, extensively used documentation and community forums for troubleshooting, and iteratively developed the application with continuous feedback to solidify my learning.

Additionally, the most important lesson I learned is not about new tools but to always leave more time for integration. People use different systems and for our group of three, we used three different systems which caused many unexpected issues. So integrating as early as possible to discern the problems to avoid last-minute issues is important.


Alby’s status report for April 6th

Accomplishments This Week:

  • Setup submodule repo for sugar and updated EC2 instance with latest version of code to allow other non-linux team members to run easier.

Challenges Encountered:

  • Multi-period optimizer is converging slowly and showing unintuitive behavior.
  • Line-powers are still incorrect by a factor of 2

Next Steps:

  • Investigate multi-period convergence across multiple epochs
  • Produce more example grid models to test the webapp
  • Further test the modifications of PQ loads to find limits
  • Fix line-power bug

Yuchen’s Status Report 04/06/2024

Accomplishments This Week:

  • Integrated Forecasting time series charts templates with current ML models of wind, solar, and load
  • Added a template for adjusting the hours we want to show for the hourly output from the optimizer
  • Solved some integration issues we experienced with the git submodule

Challenges Encountered:

  • There are still some integration issues when running SUGAR 3 locally. We suspect that it’s something very specific to Windows. We have decided to enable a remote desktop for our EC2 instance and switch to work on that later on.

Next Steps:

  • Set up a remote desktop locally for us and remotely for the AWS EC2
  • Get the optimizer running on EC2 and start user testing for basic functionalities
  • Add slider/panel for adjusting hourly forecasts

Carter’s Status Report for 4/6/24

I spent this week working on fixing issues we encountered during the integration of our three subparts as well as trying new methods for training my models that show better results than my previous methods.

Focusing on the model improvements, I was able to use the rankings provided by the Auton Lab’s AutoML tool to select Random Forest Regression as a more effective model for our wind data than LSTMs were. I was also able to discern the most effective preprocessing steps to take as well as optimal hyper-parameters, all of which i used to write a new python script for training and predicting on a random forest regression pipeline. This method achieved impressive results in terms of testing metrics, with an R^2 score of 0.922 and a NRMSE of 9.8%, the best scores we’ve gotten yet and well under our goal for this project. Next week I plan on using the AutoML tool to analyze our load and solar data as well and see if a better model can be used for each of them.

In terms of verification for my portion of the project, I’ve been utilizing Sklearn’s evaluation modules (mean_absolute_error, mean_squared_error, r2_score, etc.) to record metrics for every algorithm I try in my modeling of power data. These metrics are outputted for test data, which is unseen by the model during training to avoid data leakage. In addition, these metrics are compared with the linear regression metrics I generated at the beginning of this project, to ensure improvements have been made. In the absence of a ground truth for predictions made using future weather forecasts, I ensure manually that my results follow a logical trend over time (i.e. solar increases in the day and decreases in the night).