Team Status Report for 2/17/24

Risks

  • If multi-period optimization has early convergence issues then we will need to rapidly develop heuristics – this is a timeline risk that could push back development.

System Changes

  • Removed the building of a custom grid-lab d file processing tool because a parser already exists within SUGAR.

Schedule Changes

  • None

Please write a paragraph or two describing how the product solution you are designing will meet a specified need…

Part A.

Microgrids have significant implications for social dynamics as they can empower local communities, promote energy independence, and foster collaborative decision-making. Improving microgrids and making them easier to work with will help communities to control their power efficiently and cater their grids to their own needs, ensuring that stakeholders have a voice in the planning and operation of their energy. Moreover, by finding ways to harness renewable power more effectively and making wind and solar more predictable, we are increasing the potential reach of clean energy to underserved communities where energy is scarce, thereby promoting social inclusion and cohesion. Overall, power grids are an overlooked, yet essential way to connect distant social groups through the sharing of essential resources and making the development and control of those grids more intuitive will hopefully connect more communities to the power we take for granted.

Part B.

Microgrids have significant implications for social dynamics as they can empower local communities, promote energy independence, and foster collaborative decision-making. Improving microgrids and making them easier to work with will help communities to control their power efficiently and cater their grids to their own needs, ensuring that stakeholders have a voice in the planning and operation of their energy. Moreover, by finding ways to harness renewable power more effectively and making wind and solar more predictable, we are increasing the potential reach of clean energy to underserved communities where energy is scarce, thereby promoting social inclusion and cohesion. Overall, power grids are an overlooked, yet essential way to connect distant social groups through the sharing of essential resources and making the development and control of those grids more intuitive will hopefully connect more communities to the power we take for granted.

Part C:

Our microgrid energy management tool finds the most economically optimal dispatch of the battery and generators in the system. This saves the operator money which transfers directly to cost-saving for electricity consumers. Furthermore, the battery dispatch enables renewables to be more economic by charging during periods of excess generation and discharging during periods of low generation to meet demand.

 

Yuchen’s Status Report for 2.17.2024

This week, my focus was on exploring potential visualization methods for the gridlab-d file based on user input. While researching, I came across an open-source visualizer at https://github.com/jdechalendar/glm-plotter/tree/master/glm-plotter. However, integrating it into our project might prove challenging due to its reliance on a heavy web framework with Python 2 and outdated libraries. Additionally, it lacks functionalities essential for our needs, such as visualizing power flow and incorporating other features.

As a solution, I propose developing our visualization tool using node visualization tools. One promising option I’m considering is https://visjs.org/, a dynamic, browser-based library tailored for handling large datasets and facilitating data manipulation and interaction. My next step involves exploring its suitability for our project requirements and evaluating its potential integration.

Alby’s Status Report for Feb 17

Accomplishments:

  • incorporated feedback from proposal presentation into design presentation:
    • made a full system block diagram
    • made a optimization algorithm process chart
  • verified multi-period class interacts correctly with SUGAR3 InfeasabilityAnalysis class during the main DDP loop

Progress Reflection:

  • Didn’t meet last week goals because of an update to the battery model by the development team that made me wait until a stable build.
  • Need to work closer with development team to understand how to best work on evolving codebase

Next Week’s Goals:

  • change slack and SOC variables to class variables in battery class each period and run the inner loop for 2 periods. Then check battery SOC variable from results and verify it correctly changes – it should discharge all in the first period.

Carter Weaver’s Status Report for 2/17/24

This week is was able to initialize my codebase for experimenting with ML forecasting, and I helped my group with narrowing down our design plans for the presentation next week.

In order to inform our decisions about what training and testing methods will be most appropriate, I devoted the first half of this week to understanding the limitations of the data we have available to us. I figured out how to efficiently access wind, solar, and general weather data and then used the wind data to produce baseline results with a persistence algorithm (predicting the previous value as the next value). This allowed me to output an array of error metrics for a naive forecasting approach that I can use to revise our goals for our models and have as a benchmark for later results. After my experiments and further research into appropriate ML techniques, I spent the latter part of the week developing design plans for the forecasting portion of the project and updating our presentation slides accordingly.

I’d say we are more than on schedule with our progress so far and after we have our design fully nailed down, progress on the codebase should come quickly. Next week, I plan to generate baseline results for our solar data and load data before starting to experiment with some slightly more effective regression models (linear regression, random forest regression). We will also devote time to our design report, taking into account feedback from our design presentation.

Team Status Report for 2/10/24

This week, our main focus as a group was on taking the feedback we received for our proposal presentation and using it to shape our expectations going forward. The main recommendations were:

  • create an overall block diagram
  • create a fully defined testing process
  • specify more detailed UI requirements

Risks

  • If multi-period optimization has early convergence issues then we will need to rapidly develop heuristics – this is a timeline risk that could push back development.

System Changes

  • Added load forecasting to machine learning requirements

Schedule Changes

  • None

Carter Weaver’s Status Report for 2/11/24

This week I mainly focused on researching viable ML models for renewable energy forecasting as well as finding data sources. From my research, i was able to find multiple papers and surveys comparing methods for renewable forecasting. Based on these papers, I was able to narrow my list of algorithms that I’ll start experimenting with to SVM, RNN, ARIMA, and more. From my search for data sources I found global weather data for day-ahead forecasting and model training as well as solar radiation datasets for model validation from the National Solar Radiation Database. Data for wind turbine generation proved more difficult to find for multiple locations, but I was able to find some Kaggle datasets for turbines in Europe that could be used for validation purposes. These sources are linked at the bottom of this post.

My progress is on schedule so far. For next week I plan on setting up a remote repository for work on renewable forecasting and develop a detailed outline for our ML pipeline including plans for data scraping, preprocessing, training, validation, and testing. I intend on focusing first on SVMs as the favorite of the algorithms I found, and I’ll look to make a visual representation of our full ML pipeline.

Weather API:  https://openweathermap.org/api

NSRB Solar Datasets: https://nsrdb.nrel.gov/data-viewer

Kaggle Wind Dataset: https://www.kaggle.com/datasets/berkerisen/wind-turbine-scada-dataset


Alby’s Status Report – Feb 10

Accomplishments:

  • presented the project proposal and received good feedback.
  • made a first rough draft of the multi-period code architecture
  • implemented a simple multi-period class that runs sugar3 at each time step with specified input load

Progress Reflection:

  • met with my research advisor to discuss the next steps in building the multi-period optimization tool – need to focus more on getting initial results than polishing codebase.
  • need to speed up my work to get results soon and uncover any initial convergence issues

Next Week’s Goals:

  • test multi-period class is changing loads correctly by seeing changes in slack bus power
  • change slack and SOC variables to class variables in Batteries.py and run the inner loop for 2 periods, check battery SOC variable and verify it correctly changes

Yuchen’s Status Report for 2.10.2024

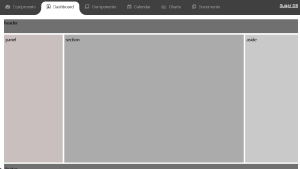
This week, my main task involves creating a preliminary template for the website’s main page, focusing on integrating the Generation and Load forecasting time series panel and the power flow network graph panel. The current website is built on the Django framework. I’ve attached a screenshot showcasing the current design progress. As you can see from the screenshot, we plan to separate various content elements, such as current machine learning outputs and forecasting results, into different tabs. This strategy aims to enhance user experience by reducing visual clutter, addressing a concern from previous design iterations.

The next step entails researching methods to enable users to upload their microgrid architecture files on the website and visualize nodes. This involves studying efficient techniques, such as utilizing a Python parser, to extract information from the user’s architecture file and generate visually appealing visualizations of the data.

Yuchen’s Status Report for 2.3.2024

As mentioned in our week’s team status report, we are in the stage of collecting the appropriate datasets and researching the complexity of the model, etc. This week, I’m responsible for the website setup and looking for data sets regarding wind direction/speed.

We’ve also decided on a clear division of labor that I will be broadly responsible for the final Web application, and I’ll also assist Carter in the ML model training process.  Regarding the final web application side, since it’s been a while since the last time I built a website, I plan to do a quick overview of CSS just to be more familiar with the format as well as UI-based libraries such as React.  In addition, I plan to start designing the front-end web interface using Figma and research how to load users’ microgrid architecture files on the website and possibly enable the user to edit the file on the website with visualization. On the ML side, I’m researching on previously done work as a reference and start to think how to implement our model in the near future.

Team Status Report for 2.2.2024

Current Challenge Overview:

Our primary challenge involves understanding what data we need and collecting appropriate datasets. We’re currently looking for localized time-series data relating solar and wind power statistics to weather patterns and using it to train a model for renewable generation and load forecasting. Selecting the right location is also and we are currently planning to choose representative states in the U.S. to cover most use cases. Additionally, we’re navigating and researching the complexities of integrating generic microgrid standards and power flow modeling programs. Risk management is a priority, and we’re developing a robust backup plan in case data collection encounters obstacles.