I spent this week verifying that our forecasting models are fully performing at the level we expect and are fully integrated into the overall system. In addition, I’ve spent the latter half of the week working on our final presentation, since I will be giving the presentation next week.
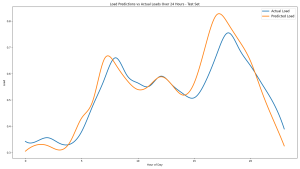
For my models, I ended up moving to a simpler architecture (random forest) for all three of my models, which has produced the best results so far. All three of my models are now achieving the goal of NRMSE <20%, including load which was the most difficult dataset to manage. After coding the pipelines for each model so that our web app can call one function to generate predictions for a given location, I also spent some time visualizing trends in our results through graphs with matplotlib, which are useful for verification purposes and to display in our final presentation. I attached an example below for reference, showing the similarity in hourly trends for our loads predictions and actual loads from our test dataset.
Next week, besides giving the final presentation, I will be focused on ensuring our web app interface is completely ready for demo.
Question: As you’ve designed, implemented and debugged your project, what new tools or new knowledge did you find it necessary to learn to be able to accomplish these tasks? What learning strategies did you use to acquire this new knowledge?
I had to learn a significant amount about energy management systems and specifically renewable energy in order to understand how to model them for our project. This mostly consisted of reading through online research papers about renewable energy forecasting to understand the concepts and methods used in the past. I also had to review and learn more about machine learning concepts I had learned in prior classes, which meant looking back at work I’ve done in those classes.

