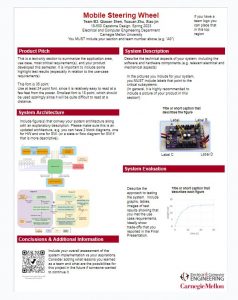
Final Poster
This is our final poster.
Team Status Report for 04/29/2023
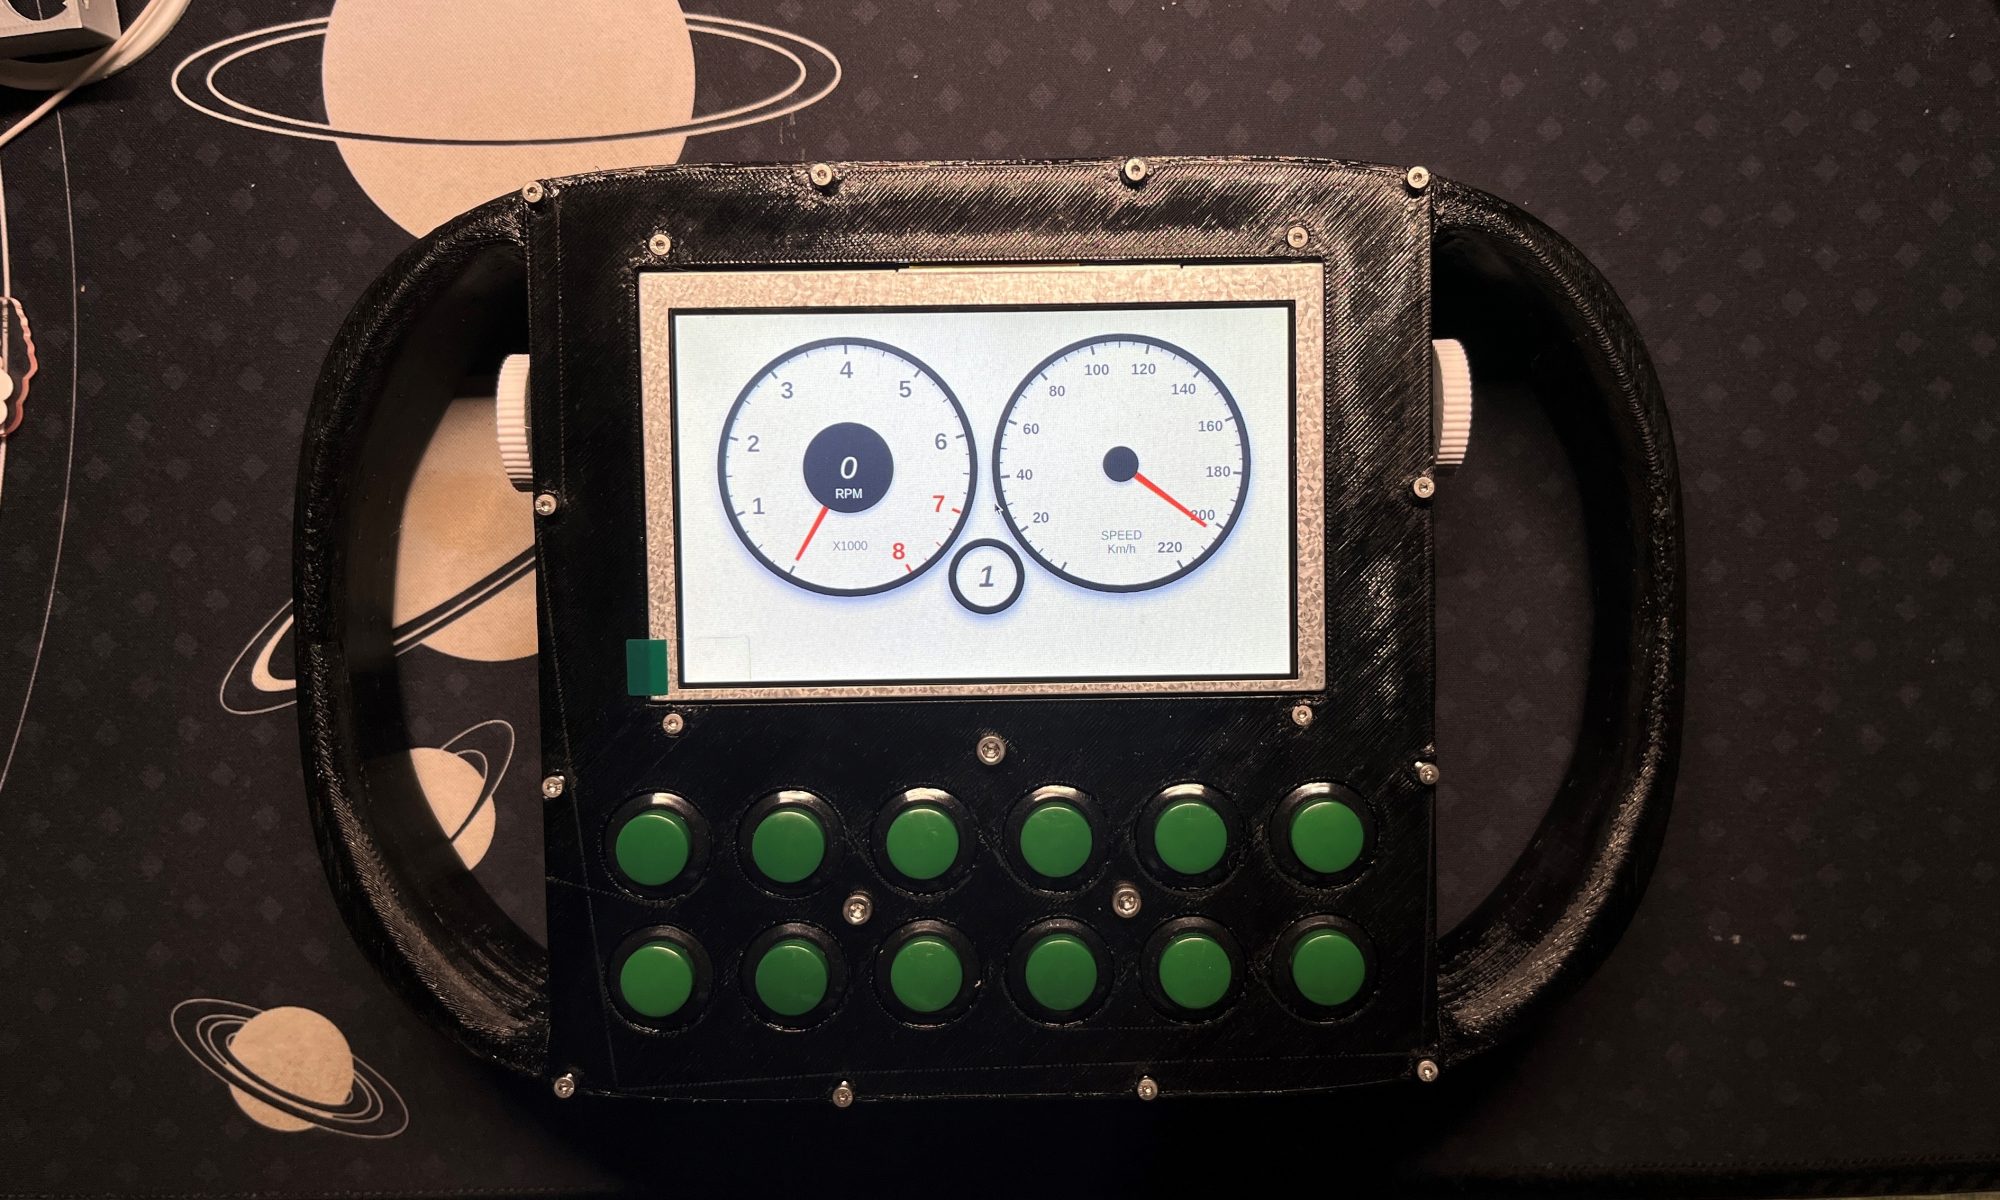
The team focus on performing tests this week. Generally speaking, the results we get are not satisfying, as we find some outputs are different from what we expect. We are keep trying to migitate those problem, and this could be a risk for us to finish the project. However, the user experience looks good as we keep using the mobile steering wheel to play the game.
Weight test:
Our project has a weight of 666g and our design goal is 400g. It seems we underestimate the weight of our components, and probably made a mistake when define the use case requirement: the joysticks we refer to do not have a big screen and a battery as large as ours, so we may want to change our use case requirement.
Battery life test:
Our project has a battery life for approximatly 4.5 hours, and our initial design aims to have 8 hours of battery life. The test results is generated from our measurement for the power consumption of our project for an average of 4W, and we have a rechargable 18.5Wh battery. The screen drains a lot of energy and we cannot add larger battery due to our trade-off between weight and battery life. I think we need to change our use case requirement for this, since 4.5 hours should be enough for normal players.
Latency test:
We plan to have around 30ms latency for the bluetooth connection. We use a slow motion to record the frames passed between the time we press a button and the time the computer receives it. In our camera has 240fps, our project takes around 28 frames to make response, which gives us a latency around 116-125ms. This differs a lot from our expection, and we are thinking if we should change our design requirement, as the experience of latency is not that large when playing with it.
Gyroscope drift test:
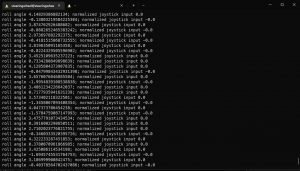
The target for the gyroscope tests are checking its stability and accuracy. The stability test requires the gyroscope to keep its drifting with in 1 degree. The result shows that the gyroscope output has some noises, but its avearge’s change is with in the 1 degree limit, as the data shown below gives us an average change within 0.8 degrees for 8 consecutive readings, and it’s not drifting away.
Qiaoan’s Status Report for 04/29/2023
This week I have two tasks:
The first and primary task is performing tests for the gyroscope part. Please check the team status report for the video about gyroscope tests. The target for the gyroscope tests are checking its stability and accuracy. The stability test requires the gyroscope to keep its drifting with in 1 degrees. The result shows that the gyroscope output has some noises, but the avearge is not drifting. To better generating this output, I want to apply a Gaussian filter (the one for image processing), which produces a result based on a weighted average of recent gyro readings, to the gyroscope results instead of separating the results to steps of 5 degrees as we implemented now to migitate this issue. The accuracy test measures the tilt error of the gyroscope. We expect the error to be smaller than 0.5 degree, due to the noise the raw data should not fit for this requirement. We are trying to generate average degree data that matches the physical degrees as we keep working on modifying the Gaussian filter to generate a more accurate average degree output.
The second task is preparing the poster for the project. I added some images to the poster and subtitute some texts.
Generally speaking, I think I’m a little behind the schedule due to new challenges we find from testing. However, one thing I noticed is that from the user experience perspective, the current version of our project runs well when I was playing with it. Next week I will focus on testing and finishing final poster and report, as well as preparing for the demo session.
Qiaoan’s Status Report for 04/22/2023
This week we have three major focuses, integrate parts together, design tests and prepare for the final presentation. A demo video can be found from the team status report to show the test.
The first test we want to perform on gyroscope is the gyroscope drifting. Our testing method is start the car in the game and put the steering wheel on the table. Then we push on the throttle and move the car forward to see if the direction is changing. Besides the information we can get from the game screen, we can also check the log from the program to see the output data, and the steering wheel angle input to the game from the game’s API. If the car’s movement on the screen, program log, and the game API all show that the angle remains constant for more than 1 min, then we think the project has passed the gyroscope drifting test.
The other test is the angle accuracy test. We want to make sure that our data output matches with the real angle of the steering wheel. We need to do this before adding the dead zone on the steering wheel around +/-180 degrees and 0 degree. To run this test, we need to match our program’s data log of output with the angle of the steering wheel in the real world. We start with placing the steering wheel at 0 degree and rotate the steering wheel until 180 degrees. The test should rotate the steering wheel in two different speeds, the first one is to rotate the steering wheel in a constant speed, and the second one is rapidly place the steering wheel to a target angle and see if the data output changes to the target. We current only test this based on our eyes so this test may have some errors, but for now the result looks good. If the steering wheel performs bad, we can buy a protractor and test it again to see where it goes wrong.
Preparing for the final presentation is another important part of works I did this week. To find a good way to explain the Madgwick filter to the audience, I need to read the paper carefully and check the function from the madgwick filter library to illustrate how we process the raw data to present on the slide. I also need to communicate with my teammates, especially Yuxuan Zhu, to help him prepare for the presentation content of the gyroscope section, since he is not very familiar with the approach of gyroscope section.
Qiaoan’s Status Report for 04/08/2023
This week:
I tired to implement the method provided by the Madgwick paper. However, even though I tried to implement Madgwick’s method as close to the code from the paper and it can give me readings that makes sense, I still find there are many problem exists.
One problem is that the degree changes from rotation changes is not accurate. I’m still very confused about this and probably I made a mistake implementing the Madgwick filter. Based on the information I get I think Madgwick filter is a correct method to solve the problem but I still need to keep working on it.
Another major problem is gyro drift when the device is stable. When I place the gyroscope on a stable surface, the gyroscope data from the filter will still keep changing slightly. I compare the data from Madgwick’s method and the accelerometer readings when the device is placed on a stable surface, and I can see two readings starting at about the same position and Madgwick’s reading will drift from the original position. I’m not sure if I made a mistake implementing Madgwick’s method or I should apply more high-pass filter on gyro data to migitate the drift, but I will keep testing this to try to figure it out before the lab on Monday. I think Madgwick filter should be able to overcome this issue based on my understanding of the paper so it’s more likely I made a mistake.
This is a tough week for me. I wish I can have more progress on Sunday. I find a more about implementation of Madgwick code by Karlsruhe Institute of Technology here https://github.com/morgil/madgwick_py, maybe I can refer to this.
Qiaoan’s Status Report for 04/01/2023
This week:
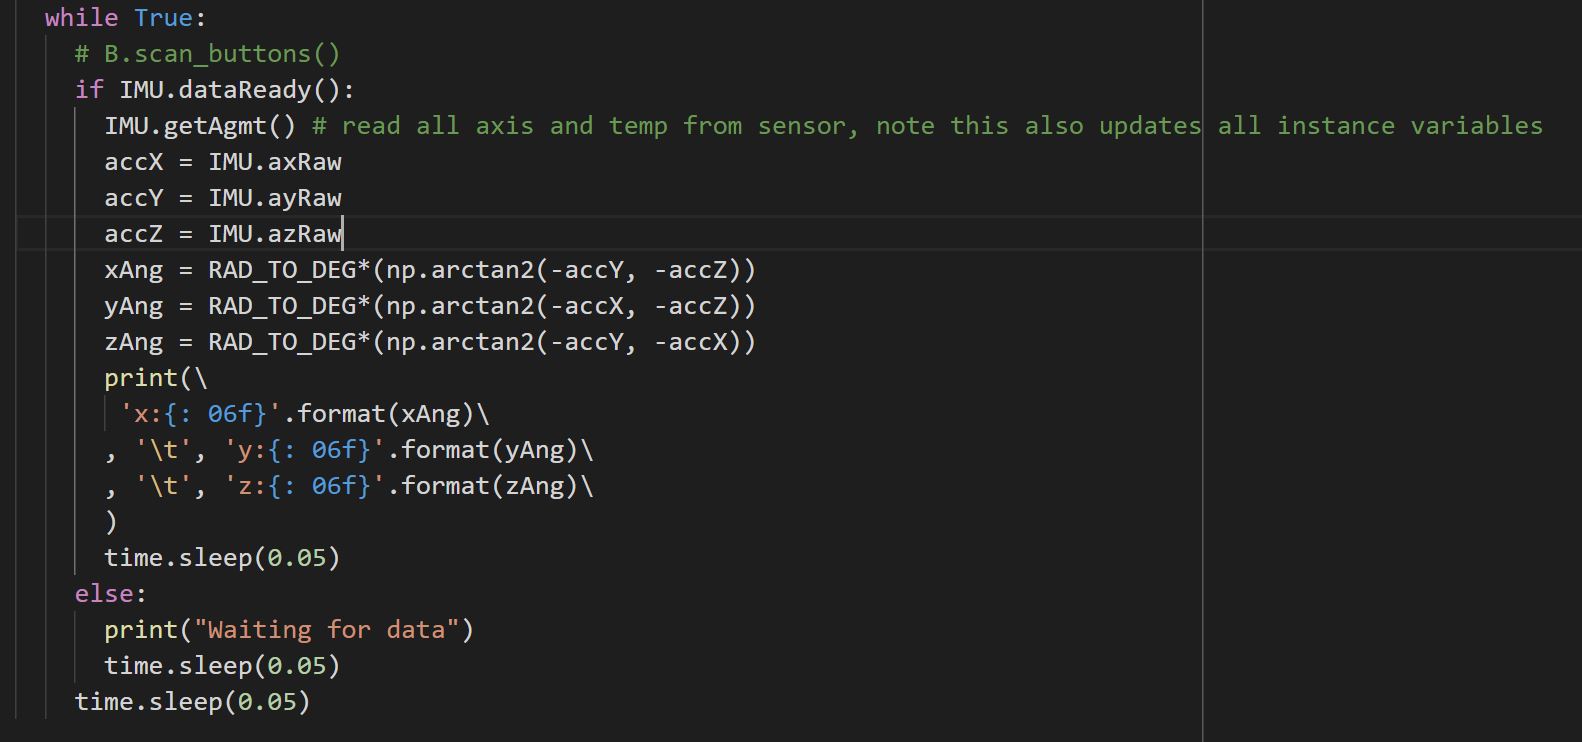
I keep working on the code for calculating the current angle of X, Y, Z axis. Currently we already have code to calculate the angle output from the accelerometer. However, this works best only if the gyroscope is not shaking too much. The current code aims to allow my partners to use the data for the demo session if possible.
The accelerometer code looks like this:
When the gyro is stable, it can correctly generate angle readings like the following rotation on z axis:
[Wordpress starts blocking me from uploading images now, I tried to remove eariler files, reduce resolution but both methods doesn’t work, I can show it during the demo session next week]
However, as I stated above, the algorithm is not very resistant to shaking. We need gyroscope data to help overcome this issue. The Madgwick paper provides a solution to combine two types of readings together. Figure 3 of the Madgwick paper provides a good explanation to its method (I cannot upload it here due to the wordpress issue). It’s clear that the method is quite complex, and I do need more time to look into this and think about how to implement the method. Luckily the paper has code appended to it, but I think I really need to fully understand it first before using it.
Here is the end of the report for this Saturday, I wish I can have more findings this weekend. I still have some questions about the paper and I will ask faculties about them if I cannot figure it out by the weekend.
Qiaoan’s Status Report for 03/25/2023
This week:
For unknown reason wordpress is stopping me from uploading images. It says The uploaded file could not be moved to wp-content/uploads/sites/230/2023/03. I’ m sorry about this and will try to add pictures back once this gets fixed.
The gyroscope system is still waiting for hardware to be ready for testing. This week let’s discuss how we can use the gyroscope readings to generate the degree output we want to feed in our functions from last week’s report.
The gyro section of data from the gyroscope should be the point we want to focus on. The reading is based on angular velocity in degrees per second. The key point is to transform this velocity data into the angular position.
The pseudo code solution could be like this: (I want to upload image for this but wordpress does not allow me to do it)
# We keep running the degree calculation in a loop
while True:
curTime = time.time()
deltaTime = curTime – prevTime # Get the time difference from the last reading
deltaDegree = dX * deltaTime
degree += deltaDegree
if degree > 360:
degree -= 360
if degree < 0:
degree += 360
This seems to be a working example to calculate the angular position. However, such method will be affected by errors and will get more and more inaccurate as time passes. Without testing I cannot determine how severe the problem could be, but we can use accelerators to calculate the current angles to calibrate the degree output.
I have a picture to explain this, I will add it with explanation after the bug gets fixed.
Assume we read accX, accY, accZ from our raw data. If we plot the direction R shown by acclerometer on the x, y, z space, and we want to map the vector on to xy, xz, yz plane as accX, accY, accZ (maybe normalize them). In our case, suppose the degree on yz plane is what we want (aka we want the reading of x’s degree), then we can easily know that cos(x) = accX/R, which means we can get x’s angle by arccos(accX/R). Then we can know the exact degree reading at the time we want.
Both two cases stated above can be used. The way based on gyro data seems to be easier, but the accelration based method is much more accurate. I will test both methods then the hardware is available.
Team Status Report for 03/18/2023
Last week all the team members are focusing on our primary goals to build or design the components of our tasks. We also spent time individually completing the ethics assignment.
The hardware system has built some successful demos of wiring and buttons. More progress on gyroscope and potentiometers will come soon by this weekend. The gyroscope system has detailed the function designs for the tunning and mapping of gyroscope readings. As the Windows laptop is received this weekend, there will be more developments on software by this weekend, though now it’s a little behind the schedule. Based on the discussion last Monday, I hope the current design of functions should provide a clearer view and explain the reason behind better. We can start running tests on this once the hardware is ready.
The team is a little bit behind the schedule considering the interim demo will be on the beginning of April. We are not sure about if the tunning design is a possible approach to solve the problems we have and only testing on hardware can answer this question. We should start testing as soon as possible.
Qiaoan’s Status Report for 03/18/2023
This week:
For the function to migitate the handshaking of users, based on the Gaussian filter model I mentioned last time that help generate a diffused image by getting weighted average value around a certain point, I would like to generate the ouput by a weighted average of a series of x, y, z readings from gyroscope.
Suppose we use x_n, y_n, z_n for note the x, y, z reading from the gyroscope at a certain time, and a_n, b_n, c_n for their weight. Then the output degree should be a result of combination of x, y, z reading from several previous readings that doesn’t differ very much as follows:

The target of tunning should be determining the value of n that indicates the number of previous readings that we want to use, and the a, b, c values to determine the weight of readings from x, y, z and based on the time of the reading (which means newer readings will have higher weight).
We will then talk about the logistic growth function that maps the gyroscope reading to output to the game, I have tried several possible combination of parameters. The function can be written as:
![]()
L means the range of our data, here since our degree output should be 0-180 degrees in each direction, so for the f(x) of each direction we define L=180.
k means the logistic growth rate, or we say the steepness of the curve, finding the correct value of k should be our target when tunning the steering wheel.
x_0 means the x value of the sigmoid midpoint. Here $x_0$ = 90 since we want the range to be 0 to 180.
I have tried several k values for this function to generate the mock output graph. Determining which k value to choose will depend on our testing result after the hardware is built. The graph is shown below:
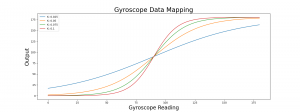
The workflow of the gyroscope system should be defined as first reading the raw data from gyroscope and store them in a first in first out list of n readings. Then use the n readings to generate the weighted output and send the result to the logistic function to map the reading to the final output.