Team Status Report for 4/30
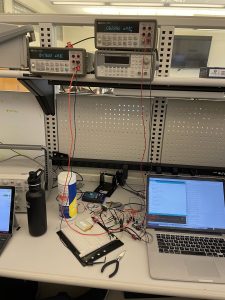
This week Ryan and Jake focused on performing a further examination of the the power consumption of each component of our hardware. Using an ammeter we found the thermal sensor, PIR and esp8266’s current draw under reading and wifi uploading, as well as under DeepSleep and light sleep. We also attempted to monitor current draw through a typical detection and upload cycle by using the oscilloscope to grab voltage off of a resistor leading into the entire circuit however this effort was unsuccessful as we tried using a tiny resistor so we could use our original power supply while still allowing every component to be in its operating window. The data we got on the oscope was far too noisy to draw any conclusions from.
For our verification and testing of the front end for capacity ( i.e how many people are website could support) we utilized an industry testing platform called Load View which is a cloud based load tester that essentially creates a simulation of however many concurrent users you want and creates load stress for your website. This is a common industry testing method taught in Jeff Epinger’s web app class called “Web Page Load Testing.” Within our application, the EC2’s point of stress is in responding to the XML requests sent out by users browsers asking for the latest data on table occupancy. What Load View provides for us is the ability to easily create a set of browsers concurrently that all have our website open and are all sending these XML requests. As our original use-case requirement was that we wanted to support 25 users we ran a stepped load where we gradually built up to 25 websites open in browser to see how load times would react. Our apache2 instance of our Django server running on an EC2 performed well we had 100% success on each test and load times even under max capacity remained under 2 seconds which is satisfactory for our user experience.
From a hardware perspective, we have a serious risk to our design which might not be resolvable this semester with our failing battery power tests (for more details on this, refer to Ryan’s Status Report for 4/30). There are two easy ways to mitigate this risk by decreasing the power consumption enough for the system to stay powered for 107 hours. The first way is to order additional hardware which will turn off the power to the thermal sensor while it is in deep sleep (which we cannot control from the processor). In order to last for 107 hours, our system has to consume at most 11.2mA per hour, and it is currently consuming 14.76mA in its most optimized state. However, the thermal sensor is responsible for 5mA of that consumption, so turning it off when the processor goes into deep sleep will reduce that number to around 9.8mA which is well under that mark. The second way would be to order a battery with an increased capacity. Our system currently consumes about 7.8Ah of energy, so any battery larger than that would be sufficient. While both of these options are very feasible, we would not be able to make these adjustments by the end of the semester. Fortunately, though, we won’t need to last nearly as long for our demo, and should have no problems with staying powered for the whole time. From a hardware perspective, all that’s left to do is to fine-tune occupancy detection algorithm thresholds for Weigand Gym and potentially figure out a more elegant way to mount the sensors than with tape, and we should be ready!
For frontend, we should be mostly ready to go for the web app, and we plan to migrate that to a mobile friendly version as well. The planned statistics are implemented and we also plan to do user testing in the UC before the demo to make sure that the integration between hardware and software is seamless enough to not interrupt user experience.
Ryan’s Status Report for 4/30
This week, I worked on two things. First, I helped finalize the final presentation and watched other groups’ presentations (which were all great)! Second, and more importantly, I did a lot of power testing for the system. Specifically, I tested the power draw of both sensors, as well as the power draw of the system with different code/states running (including no optimizations, delay statements between loops, and deep sleep). Unfortunately, I ran into a big issue in that the processor was consuming far more power than specified by the datasheet. While the datasheet rated the processor in deep sleep consuming only 10uA of current, the measured system current consumption in deep sleep was consistently 14.6mA, a factor of 1000x higher than expected. This included the PIR sensor consuming around 50uA of current (regardless of state) and the thermal sensor consuming around 5mA of current (regardless of state), so the processor is still consuming much more than we had accounted for. With all this being said, our battery should only last about 82/107 hours required by our use case. This creates a clear risk to our design meeting our use case which I will outline more in the team status report.
Next week, I plan on completing a couple of battery tests to confirm that the battery will not last its full duration. In addition, I will finish out the semester by finalizing our poster, doing some fine-tuning on thresholds of the occupancy algorithm for Weigand Gym, and turning in the final report. I am more or less on schedule — I am adding in some confirmation battery tests to tie a bow on the power testing which would have been nice to have done by now, but I shouldn’t have a problem getting those in for the final report.
Angela’s Status Report 4/30
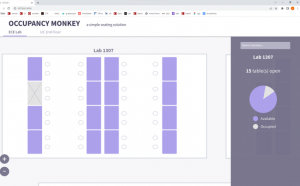
The beginning of this week, I mainly focused on preparing for our final presentation. Past that, I was able to get a fully working website with the features as described in the presentation. I kept the demo layout with “4 tables” even though we are switching the layout around, because ultimately it will act as 4 separate tables.
In terms of user testing, I first went around a small group of people with the front end first, while changing the sqlite file to emulate occupational changes. They suggested labeling the different areas even if the area is labeled on the tab to the side just for further convenience.
For future development, I will convert this to a mobile friendly version as well as planning to conduct user tests in the UC with the actual sensors before the final report.
Jake’s status report for 4/30
This week Ryan and I focused on performing a further examination of the the power consumption of each component of our hardware. Using an ammeter we found the thermal sensor, PIR and esp8266’s current draw under reading and wifi uploading, as well as under DeepSleep and light sleep. We also attempted to monitor current draw through a typical detection and upload cycle by using the oscilloscope to grab voltage off of a resistor leading into the entire circuit however this effort was unsuccessful as we tried using a tiny resistor so we could use our original power supply while still allowing every component to be in its operating window. The data we got on the oscope was far too noisy to draw any conclusions from.
For our verification and testing of the front end for capacity ( i.e how many people are website could support) I utilized an industry testing platform called Load View which is a cloud based load tester that essentially creates a simulation of however many concurrent users you want and creates load stress for your website.
This is a common industry testing method taught in Jeff Epinger’s web app class called “Web Page Load Testing.” Within our application, the EC2’s point of stress is in responding to the XML requests sent out by users browsers asking for the latest data on table occupancy. What Load View provides for us is the ability to easily create a set of browsers concurrently that all have our website open and are all sending these XML requests.
As our original use-case requirement was that we wanted to support 25 users we ran a stepped load where we gradually built up to 25 websites open in browser to see how load times would react. Our apache2 instance of our Django server running on an EC2 performed well we had 100% success on each test and load times even under max capacity remained under 2 seconds which is satisfactory for our user experience.
This upcoming week we plan to do a trial demo on wednesday and tweak occupancy detection code but beyond that we are on schedule for having everything finished this week.
Jake’s Stauts report for 4/23
This week we finished off the final versioning of our testing code and began testing and validation on this. Ryan and I integrated our different code sections so that we both have the thermal detection algorithm and aws connection code in the same file. We then used this to run a test determining our battery life. We used a smaller battery than the one we will deploy with 1/3 capacity and ran it for 36 hours to ensure we could meet our project requirements. I also created a spoofing script that would generate the worst case conditions power wise for our devices i.e. detecting someone who immediately leaves. I additionally helped assemble several of the bread boards. We are on schedule for this next week and we will spend our remaining time finalizing things or our demo. This will largely focus on generating graphs from different tests for our slideshow and final report
Team Status Report for 4/23
From a hardware perspective, we were fortunately able to avoid any design changes, as we were able to integrate the thermal sensor into the design both hardware- and software-wise after many tribulations. We began battery tests and will have results for those tests on Sunday before the final presentation is due. Additionally, we will complete power unit testing with different sections of code on Sunday before the final presentation, and we hope to get a much clearer picture of how closely our design is matching our use case. One big risk is either power or battery testing failing, both of which would indicate that our system consumes more power than expected and we won’t be able to meet our battery life use case. However, should that be the case, we have a couple of risk mitigation plans that we hope will solve the problem. We still haven’t introduced specific optimizations to the code which should significantly reduce power draw, including better use of deep sleep and potentially using a light sleep in the few seconds between the processor taking readings from each sensor. Additionally, we should be able to reduce the amount of readings required to determine an occupancy change without any major sacrifices in accuracy, which would allow us to take less readings per minute and further reduce power draw, while still meeting our use case of accurately updating occupancy status within a minute of it changing.
Ryan’s Status Report for 4/23
I made a bunch of progress this week. Most of my work was put into integrating the thermal sensor into the final design, which ended up being much more painful than anticipated. The one thermal sensor we had was broken and I unfortunately didn’t have any good way of verifying that the sensor worked until the rest of them arrived on Wednesday, so I spent a lot of time early in the week writing and running different segments of code in an attempt to debug things. Fortunately, after getting new thermal sensors, I was able to get the system running on an Arduino Uno pretty quickly, and then after a bit more work I was able to transfer everything over to the ESP system, which is now running a functional occupancy detecting algorithm using both sensors! The final hardware design can be seen below (although the design will be on a smaller breadboard for the final demo).
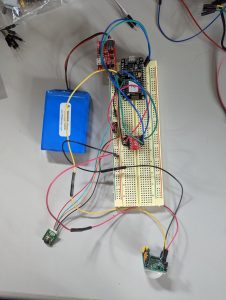
As a very important note to future teams looking to do something similar, we made the design decision early on to use an ESP8266 dev board with both a processor and a wi-fi chip built in as opposed to using an Arduino with an external wi-fi chip to reduce the amount of hardware, since the ESP can still compile Arduino code. Although this was a good idea in theory, it made things much harder for both myself and Jake, as the Arduino is much more user-friendly than the ESP for software development and has much more existing uses and documentation to learn from. If we were to restart this, we would definitely develop things on an Arduino instead.
After finishing all that up, I then assembled the rest of the hardware nodes to work with Jake to kick off battery testing. While we shouldn’t have definitive results until tomorrow (fingers crossed, because it means the batteries will have lasted at least a day), those results will be in on time for the final presentation. I am also planning on working with Jake tomorrow on unit power testing to further verify that our system is within our power consumption use case requirement. We will be measuring power draw out of different components while running different sections and libraries of code in a further attempt to optimize power, and preliminary results for those should also be done by the final presentation. If all ends well, I will spend the rest of next week hearing other presentations and preparing for our demo. If not, which is probably the more likely scenario, I have a risk mitigation plan which I will detail in the team status report. Currently I am pretty well on schedule to finish everything out, and I am hopeful that will stay the same for the rest of the semester!
Angela’s Status Report 4/23
This week, I was able to re-design our front-end as well as figure out the mobile vs. desktop versions. Here is a prelim screenshop of the desktop design: 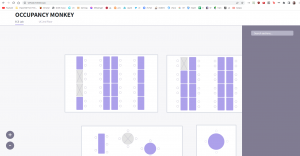
and it zooms in and out a lot better than before. This is already implemented and included in the final website.
I was able to change the theme and improve the mapping a lot more while maintaining the integrity of the sensors.
The mobile version would look more like this: 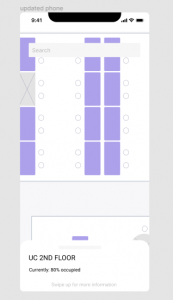
which is more of a mockup but not hard to implement for this week.
We are also, as a group, making sure our final presentation is sound before Monday, including all our last minute changes.
Team Status Report for 4/16
This week we focused on completing a few of the remaining things from our schedule. The first of these was to convert the EC2 database to run MySQL. For the demo we were just running sqlLite as a proof of concept but to ensure we are optimizing for our design requirements a change to MySQL was preferred. We also deployed a still old but upgraded front end html and django code and implemented that on the ec2 so that it runs on our website.
We additionally developed two of the tests/validations our team initially had planned to do. The first of these is tracking the aws -> website capacity and loading times. We are utilizing GTMmetrix which is a pretty standard speed test tool that performs multiple tests across various browsers, locations, and connections. We have yet to run this as Angela is finishing up her finalized front end which is the element of our pipeline this seeks to stress test. The Second of these tests is a fleet of node mcu’s that all are publishing json packets. This stress tests the device node -> aws capacity. This is more of a verification/validation than a test as there isn’t a solid metric for this other than delay and packet loss.
Last week we mentioned that we needed to convert all devices to access CMU-SECURE through a wifi access point as CMU-DEVICE was blocking certain things we were trying to do with NTP. Now that we have confirmed our final demo location as Wiegland Gym we have concluded an ethernet based wifi access point is not viable as there isn’t accessible ethernet access for our team. We are going to test one of these options, using a Samsung Phone as a wifi repeater this upcoming week. This is probably our greatest issue for risk mitigation at the moment. Our initial demo proved that we can still have a working project without this solution however to realize the full vision of our project this will need to be solved.