Angela’s Status Report 4/30
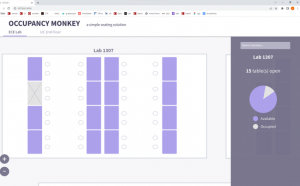
The beginning of this week, I mainly focused on preparing for our final presentation. Past that, I was able to get a fully working website with the features as described in the presentation. I kept the demo layout with “4 tables” even though we are switching the layout around, because ultimately it will act as 4 separate tables.
In terms of user testing, I first went around a small group of people with the front end first, while changing the sqlite file to emulate occupational changes. They suggested labeling the different areas even if the area is labeled on the tab to the side just for further convenience.
For future development, I will convert this to a mobile friendly version as well as planning to conduct user tests in the UC with the actual sensors before the final report.
Jake’s status report for 4/30
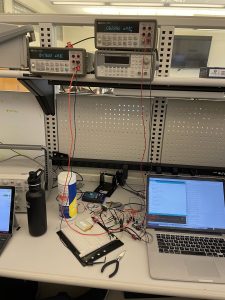
This week Ryan and I focused on performing a further examination of the the power consumption of each component of our hardware. Using an ammeter we found the thermal sensor, PIR and esp8266’s current draw under reading and wifi uploading, as well as under DeepSleep and light sleep. We also attempted to monitor current draw through a typical detection and upload cycle by using the oscilloscope to grab voltage off of a resistor leading into the entire circuit however this effort was unsuccessful as we tried using a tiny resistor so we could use our original power supply while still allowing every component to be in its operating window. The data we got on the oscope was far too noisy to draw any conclusions from.
For our verification and testing of the front end for capacity ( i.e how many people are website could support) I utilized an industry testing platform called Load View which is a cloud based load tester that essentially creates a simulation of however many concurrent users you want and creates load stress for your website.
This is a common industry testing method taught in Jeff Epinger’s web app class called “Web Page Load Testing.” Within our application, the EC2’s point of stress is in responding to the XML requests sent out by users browsers asking for the latest data on table occupancy. What Load View provides for us is the ability to easily create a set of browsers concurrently that all have our website open and are all sending these XML requests.
As our original use-case requirement was that we wanted to support 25 users we ran a stepped load where we gradually built up to 25 websites open in browser to see how load times would react. Our apache2 instance of our Django server running on an EC2 performed well we had 100% success on each test and load times even under max capacity remained under 2 seconds which is satisfactory for our user experience.
This upcoming week we plan to do a trial demo on wednesday and tweak occupancy detection code but beyond that we are on schedule for having everything finished this week.
Jake’s Stauts report for 4/23
This week we finished off the final versioning of our testing code and began testing and validation on this. Ryan and I integrated our different code sections so that we both have the thermal detection algorithm and aws connection code in the same file. We then used this to run a test determining our battery life. We used a smaller battery than the one we will deploy with 1/3 capacity and ran it for 36 hours to ensure we could meet our project requirements. I also created a spoofing script that would generate the worst case conditions power wise for our devices i.e. detecting someone who immediately leaves. I additionally helped assemble several of the bread boards. We are on schedule for this next week and we will spend our remaining time finalizing things or our demo. This will largely focus on generating graphs from different tests for our slideshow and final report
Ryan’s Status Report for 4/16
This week, I spent my time in two areas. First, I put together a bill of materials and ordered components for three more hardware nodes for the final demo, as well as for fuller system testing. Fortunately, most of the parts (all of them but the thermal sensor) came in the day after I ordered them, so I was able to assemble the rest of the hardware nodes, including soldering male-to-male headers on the battery converter boards and level shifter boards. The thermal sensor is pretty trivial to wire up, so I’m not worried about having to integrate those in a timely fashion.
The other thing I worked on was integrating the thermal sensor into the hardware design. I first went through hardware specs to figure out how it wires up, and realized that the pull-up resistors built into our level shifter board were sufficient enough in creating a voltage difference between the data and clock lines for the thermal sensor I2C and no additional resistors were needed. Most recently, I have spent time writing code to actually turn on and obtain readings from the thermal sensor. I am currently working on that now, and expect to have that up and running by class on Monday, which is within my planned schedule.
Next week, I plan on finishing up the thermal sensor integration, hopefully assembling the rest of the hardware nodes once the thermal sensors get in, and then I will run battery and power consumption tests to make sure our hardware is in spec with our use case requirements. If this is not the case, the risk mitigation plan is to increase the power efficiency of the code, either by using lower power libraries/using resting states more effectively or by limiting the uptime of the PIR sensor, which according to my calculations (and pending unit testing) should be the heaviest power consumer of any individual component.
Angela’s Status Report 4/16
This week, I was in direct contact with someone who tested positive, so I was not able to make it to class, as well as still feeling extremely sick. However, I was able to get frontend work done. The main feature I was able to get working was the zoom on the map. This includes being able to zoom out enough to see different sections in the full map as well as zoom in to individual tables.
Next week, I hope to finish all features of the frontend as well as helping out with hardware testing and load/stress testing. The features would include having different tabs for different sections and refining the proportions so that the website would look as planned on all phones.
Right now, I want the web app displayed on a desktop/laptop to look like this:

while the mobile app looks the same. Currently, I’m using responsive web design (responding to different screen sizes/media) in order to accomplish this.
Angela’s Status Report 2/19
This week, I was unable to do much as I was lacking AWS access. However, I was able to more carefully plan out the front end as well as design a rough UI on Figma for our web application.

I think a big problem with designing the UI was knowing what information we want to portray to the user and how much information we can gather from the sensors.
Jake’s Status Report for 2/12
I conducted a lot of research into our use case, the seating situation in the UC, and gathered a few metrics that could be used to drive our requirements and began preliminary design around these. Primarily I began to experiment with the PIR sensors for occupancy detection. I determined area of detection and explored feasible deployment techniques. We will likely focus our sensors directly downward from underneath the table. As most sensors we are looking at have a cone of detection < 120 degrees this ensures we can detect occupancy at any direction around the table with a single sensors as well as ignore the noise of passing students. I additionally started playing with code for linking our microcontrollers to the web.