
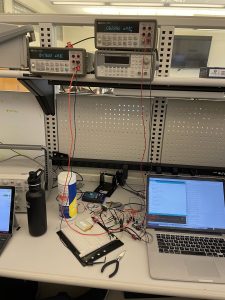
This week Ryan and Jake focused on performing a further examination of the the power consumption of each component of our hardware. Using an ammeter we found the thermal sensor, PIR and esp8266’s current draw under reading and wifi uploading, as well as under DeepSleep and light sleep. We also attempted to monitor current draw through a typical detection and upload cycle by using the oscilloscope to grab voltage off of a resistor leading into the entire circuit however this effort was unsuccessful as we tried using a tiny resistor so we could use our original power supply while still allowing every component to be in its operating window. The data we got on the oscope was far too noisy to draw any conclusions from.
For our verification and testing of the front end for capacity ( i.e how many people are website could support) we utilized an industry testing platform called Load View which is a cloud based load tester that essentially creates a simulation of however many concurrent users you want and creates load stress for your website. This is a common industry testing method taught in Jeff Epinger’s web app class called “Web Page Load Testing.” Within our application, the EC2’s point of stress is in responding to the XML requests sent out by users browsers asking for the latest data on table occupancy. What Load View provides for us is the ability to easily create a set of browsers concurrently that all have our website open and are all sending these XML requests. As our original use-case requirement was that we wanted to support 25 users we ran a stepped load where we gradually built up to 25 websites open in browser to see how load times would react. Our apache2 instance of our Django server running on an EC2 performed well we had 100% success on each test and load times even under max capacity remained under 2 seconds which is satisfactory for our user experience.
From a hardware perspective, we have a serious risk to our design which might not be resolvable this semester with our failing battery power tests (for more details on this, refer to Ryan’s Status Report for 4/30). There are two easy ways to mitigate this risk by decreasing the power consumption enough for the system to stay powered for 107 hours. The first way is to order additional hardware which will turn off the power to the thermal sensor while it is in deep sleep (which we cannot control from the processor). In order to last for 107 hours, our system has to consume at most 11.2mA per hour, and it is currently consuming 14.76mA in its most optimized state. However, the thermal sensor is responsible for 5mA of that consumption, so turning it off when the processor goes into deep sleep will reduce that number to around 9.8mA which is well under that mark. The second way would be to order a battery with an increased capacity. Our system currently consumes about 7.8Ah of energy, so any battery larger than that would be sufficient. While both of these options are very feasible, we would not be able to make these adjustments by the end of the semester. Fortunately, though, we won’t need to last nearly as long for our demo, and should have no problems with staying powered for the whole time. From a hardware perspective, all that’s left to do is to fine-tune occupancy detection algorithm thresholds for Weigand Gym and potentially figure out a more elegant way to mount the sensors than with tape, and we should be ready!
For frontend, we should be mostly ready to go for the web app, and we plan to migrate that to a mobile friendly version as well. The planned statistics are implemented and we also plan to do user testing in the UC before the demo to make sure that the integration between hardware and software is seamless enough to not interrupt user experience.