Suann progress report 3/30/19

I discovered that one sensor was enough to record knock information on a board. This was only clear after plotting serial output from the Arduino. This is great because then no extra parts need to be soldered or hooked up.

I got serial communications between the arduino and the laptop to work. The arduino sends data to the Python script in a loop and the computer receives it without a hitch.

My goal for next week is to determine what kind of hard threshold is necessary to bar fake knocks while allowing real knocks to be input into the system. Additionally I need to tie together the arduino code that senses knocks and the code that sends serial information to the Python.

Tanushree Status Report 3/30

I worked with Isha to integrate my GUI subsystem with her detection subsystem. I added the following functionalities to my GUI in order for the integration to work:

1. After receiving the calibration coordinates from Isha’s part of the code, I set them as reference points and used to calculate the observed width and height of the GUI as seen by the camera used for the detection algorithm.

2. On receiving the coordinates of the red dot from Isha’s detection code, I calculate the position of the user’s finger with respect to the actual GUI coordinates. Thus, the red dot observed by the camera needs to be transformed to a scale that matched the GUI dimensions.

I tested my code using synthetic data: hard-coded the calibration coordinates and red dot coordinates according to the the test images we took on Tuesday. The mapping code works but with some degree of error. Thus, following will be my future tasks:

1. I will be working on testing my code on real time data and make appropriate changes to improve the accuracy .

2. I will also be working on integrating the tap detection subsystem with the GUI and detection subsystems.

Below is an example test image:

Below is the GUI and the mapped coordinate of the red dot is shown with a red ‘x’. Since it is within the button, it launches the modal containing the text from the appropriate file:

I am currently on schedule.


Team Status Report 3/30

Currently, the most significant risk is integrating all three of our subsystems together and achieving a high accuracy for our overall system. We have already integrated two subsystems and will be integrating the third this week. Thus, we will have about a month to test our system and make appropriate changes in order to improve its accuracy. We want to also ensure smooth user interaction with our interface without interruptions.

We have decided to stick with Arduino instead of moving to the Pi in order to stay on schedule. If we had stuck with the Pi we would need to wait a week for additional circuit components to come in.

No changes were made.

Isha Status Report 3/30

On the 24th, Suann and I took a set of 100 test images that I used to compile more training data.

I wrote a script to detect the green border around the perimeter of our gui screen. Tanu is using these border coordinates to calculate the identified coordinate of the red dot on the gui. This coordinate is proportional to the detected coordinate of a red dot in an image taken with the Logitech webcam. However, when we tested this script in the demo environment, we realized that the green color that was projected was much lighter and more variable than expected. So we decided to change our calibration function so that we utilize our red color detection. A user now calibrates the screen by placing a red dot on the upper left corner of the projected gui and clicking the “Get Coordinate” button that will calculate the dot’s coordinates. The process is repeated with the dot placed at the lower right corner of the screen. These coordinates are then passed to Tanu’s calibrate() function. The gui interface for the calibration is show below.

Calibration GUI:

Tanu and I have integrated our components of the project: gui and detection. I have added two buttons to the top left of the gui as placeholders for input from the piezo sensors. One button will detect the coordinates of a user’s finger and the other will open the dialog box to calibrate the screen.

GUI:

I have also compiled more data from the set of test images that we took on the 27th and added the data to our csv file. Now that we have more than 30 million datapoints, I had to leave the program running overnight to train the classifier. I will work on possibly combing through the data to reduce the number of datapoints and I will try to train with alternative svm classifiers to cut down on this time. I have found some possible solutions in this post. Our previous classifier had a response time of about 0.33 seconds on average. The newest one has a response time of on average 3.26 seconds. This is a huge difference. We may have to make a tradeoff on whether we want more accurate results or a faster response.

My progress is on schedule.

Next Steps:
1. Try to train using alternative methods to reduce training time.
2. Test the calibration function and detection in real time and compile accuracy results.

Tanushree Status Report 3/23

I finished writing the code for the first iteration of the GUI using PyQt. I have implemented the following functionalities:

1. The GUI application launches in full-screen mode by default and uses the dimensions of the user’s screen to provide the baseline for all calculations regarding button sizes and placement. This allows the GUI to be adaptable to any screen size, making it scalable, thus, portable.

2. Since we plan on demonstrating our project as an intractable poster board, on receiving the coordinates where the tap occurred, the application correctly identifies which button was tapped, if at all, and creates a modal displaying information from the appropriate text file corresponding to the topic associated with the clicked button. Once the user is done reading this information, he/she can press the return button to go back to the original screen.

Currently, the GUI has been designed such that there are six buttons relating to six different headings. The background has been set to black, while the buttons are a dark grey. And the buttons have been spaced out enough to help us achieve a better accuracy when detecting which button was tapped. These are open to changes as we keep testing for the next few weeks.

I am currently on schedule. My next tasks include:

1. creating a function that would help map the coordinates detected by the color detection algorithm to the coordinates in the GUI, using the green border coordinates that Isha will be detecting.

2. find a way to pass the detected coordinates to the main GUI application after it has been executed. I will look into some PyQt built-in functions that allow to do that.

Suann 3/23/19 Status Update

I ordered an SD to install Raspbian on the the Raspberry Pi. I have hunted down soldering irons and soldered extra wire to some sensors so that they are easier to prototype with.

I have created the arduino sensor circuit with one sensor that was able to detect knocks. I have also worked with setting up tap sensing with poster board setup to see how effective the sensors were. It seems for our poster board size we will need at least 6 or 7 sensors to effectively receive taps over the whole area.

I will work on expanding the current prototype to multiple sensors. I will also change the current arduino sensor script to read knocks from multiple inputs. I will look into soldering a multiple circuit setup on a protoboard instead of keeping it on a breadboard. Since the SD card came in I will also start setting up the Raspberry Pi.

Team Status Report 3/23

What are the most significant risks that could jeopardize the success of the project? How are these risks being managed? What contingency plans are ready?

We are concerned about our planned method of mapping the detected coordinate in an image to the gui. We are not sure if in practice our design will be accurate. Our plan is to detect the coordinates of a green border along the perimeter of our gui. We will use these coordinates to find the relative distance of the button coordinates to the border. In the case that these detected coordinates are not precise enough for this application, we will place four distinctly colored stickers at the edges of the gui and will use these as reference.

We are also concerned about using the raspberry pi and Python for the piezo sensor circuit. We are prototyping with an Arduino for now and if we are unable to use the raspberry pi, we will continue to use the Arduino and send data to our Python color_detection.py script through a serial port. In this case, we will have to deal with any possible delays in sending a message to the python script.

We also need to spend a significant amount of time taking more test images to train our SVM. Currently, we have 26 test images with our poster board setup. We will work on taking more test images this upcoming week.

Were any changes made to the existing design of the system (requirements, block diagram, system spec, etc)? Why was this change necessary, what costs does the change incur, and how will these costs be mitigated going forward?

No new design changes were made this week.

Isha Status Report 3/23

I converted the Matlab code for color detection with thresholds to Python using numpy and matplotlib.

I also wrote code to use Python to access the camera. I first tried using pygame to do this using the code from this link. However, a past image kept showing up when taking a new image since when the camera starts, a significant number of frames from the previous session are saved. Then I installed opencv and found this code to capture an image when hitting the space bar. This can be easily adapted to take in input from the piezo sensor circuit when a tap is detected.

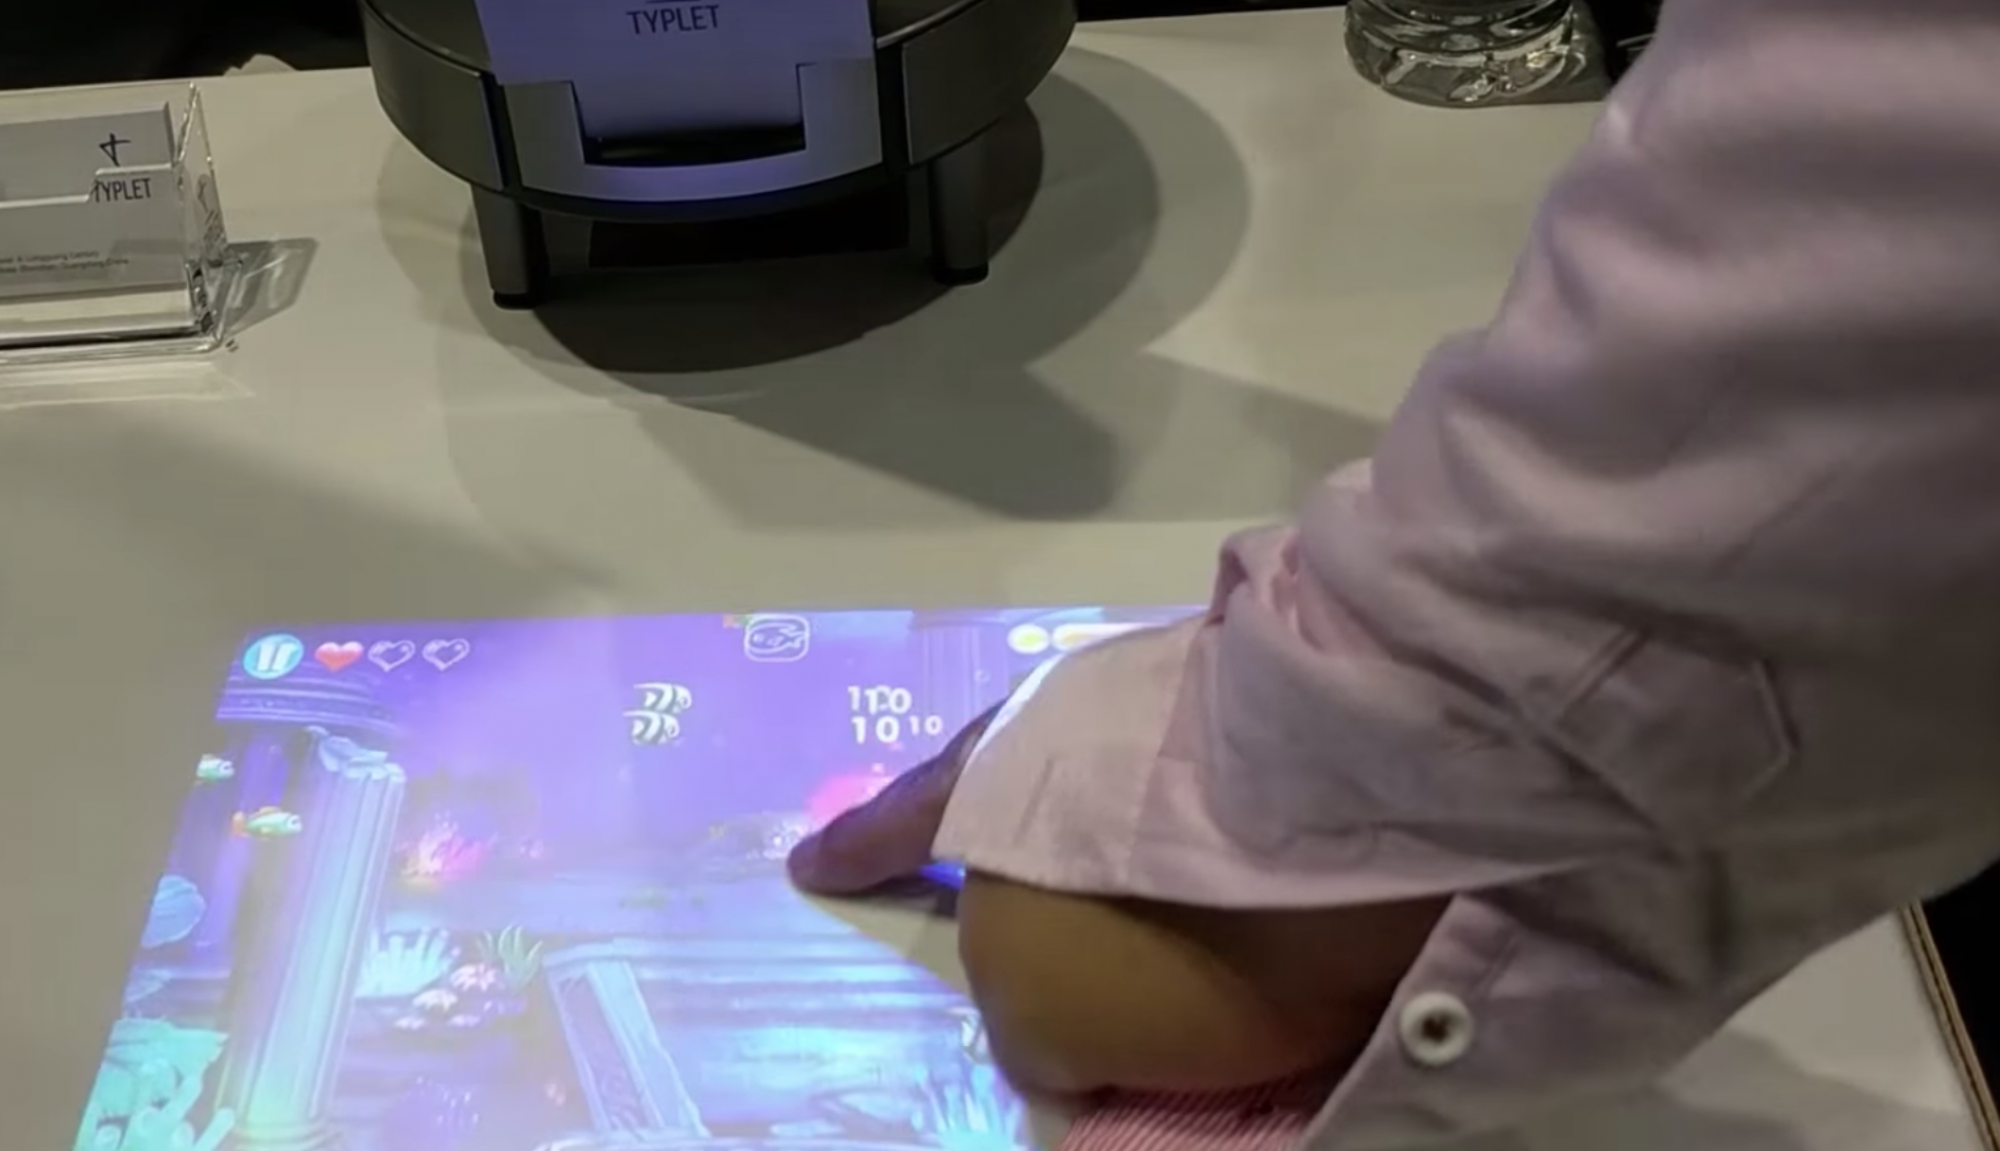
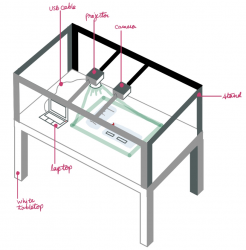
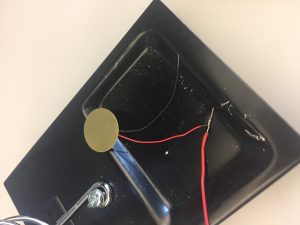
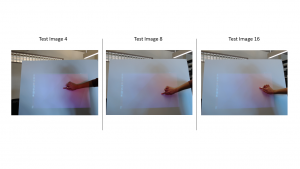
We took a new set of 26 test images with our new poster board set up.

I finished the SVM code using scikit-learn to detect a red dot. I wrote a csv file, coordinates.csv, containing data from our test images to use to train the algorithm. I wrote the following files:

test_svm.py:
Loads data from file coordinates.csv. Uses the data to train the SVM algorithm. Uses the trained algorithm to predict if each pixel is red or not. Then finds the centroid of the red pixels and displays the image with the centroid plotted.

write_data.py:
Loads an image and searches for the red coordinates with hard thresholds. Uses a 2 pixel radius around the coordinate to find the values of red pixels. Saves the pixel A and B space values along with a 0 if it is a red pixel and 1 if it is not a red pixel to a csv file coordinates.csv

coordinates.csv
Contains data for the SVM alogrithm in the following format:
(A space value) (B space value) (0 for red/1 for non red)

color_detection.py
Loads data from coordinates.csv to train the algorithm. Takes a frame from the Logitech webcam when the spacebar is clicked. Analyses the image to find the centroid of the red pixels in the frame using SVM to predict if a pixel is red or not.

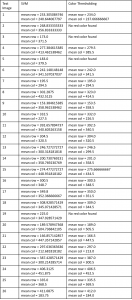
I looked at the results for all the 26 test images we have. The SVM code gets incorrect results for tests 4, 8 and 15 as shown below:

Basic color thresholding does not find red pixels for tests 2, 3, 5 and 19. I have saved these image results to the bitbucket repo so we can compare them.


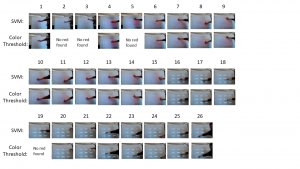
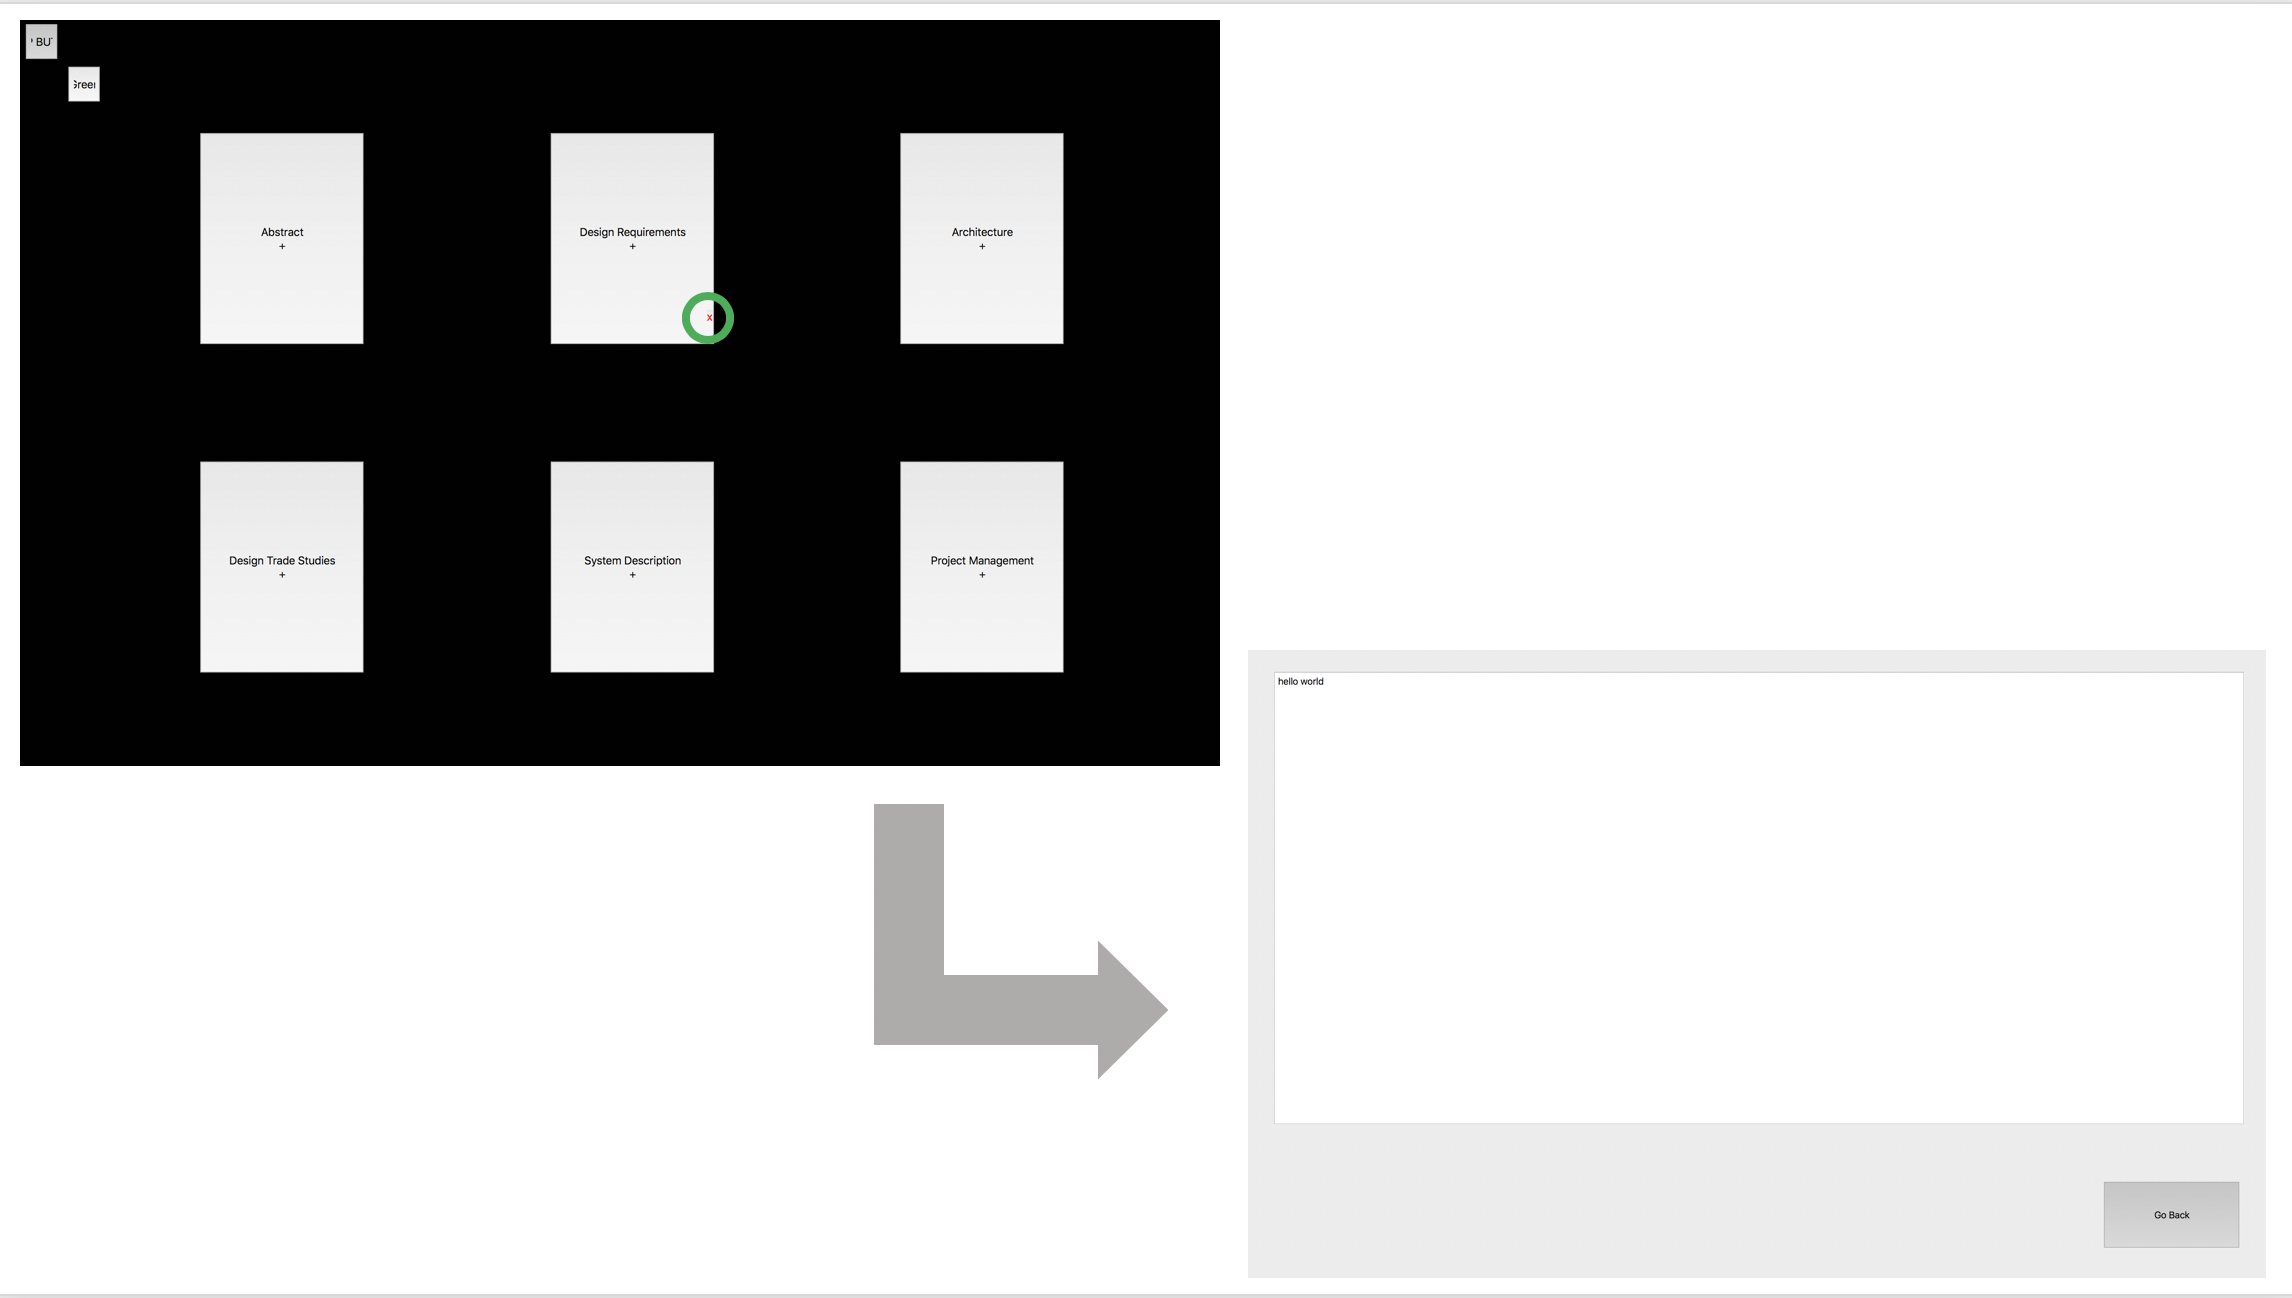
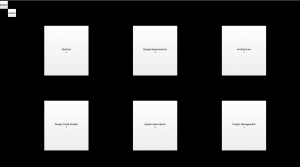
The detected coordinate of the red dot is slightly different for the two measures. A chart of the coordinates is included at the end of this post. I think the svm is not detecting the proper coordinate for all cases because right now it is only being trained on images 12-26 and not the images 1-11. I had only saved data from these images since the preliminary gui is projected on the poster in these images. Once I add all the data to the dataset I think that the algorithm will become robust enough to cover all our current test cases. I will also start to constrain our dataset to only contain every 10th pixel that is not red since the data file has become very large as each image has 480×640 pixels.

My progress is on schedule.

Next week’s deliverables:
Constrain the write_data.py script to write values for every 10th script instead of all the pixels
Detect green pixels in the image for border detection to be used in Tanu’s gui  coordinate calculations.

Suann Status Report 3/9/19

This week I spent many hours writing the ethics paper, whose due date got pushed back. Due to assignments in other classes I was not able to work on much else.

I have ordered the SD card needed for installing the Raspberry Pi this week.

For this upcoming week, I plan to prototype using an Arduino since the SD card I ordered has not yet come in. I will additionally work on setting up the camera using a Python script so that it will work with our computers.

Tanushree Status Report 3/9

I am working on the GUI which will be created using PyQt. I re-familiarized myself with the OOP paradigm in Python as it has been a while since I last used Python for OOP. I am also learning about PyQt, which I have not worked with before. Since I am assigned to work on the entire GUI setup, I decided to breakdown this broad task into smaller tasks of the kinds of functionality we need for our project and the UI that will work best for our color detection algorithm:

This may change as I familiarize myself with PyQt more, leading to a change in my thought process. For next week or so, I will continue to work towards implementing the tasks I have outlined above. This will be testing this system along the way and also at the end when integrated with real time data. I am so far on schedule.