Note: This weekly status report covers any work performed during the week of 10/15 as well as Fall Break.
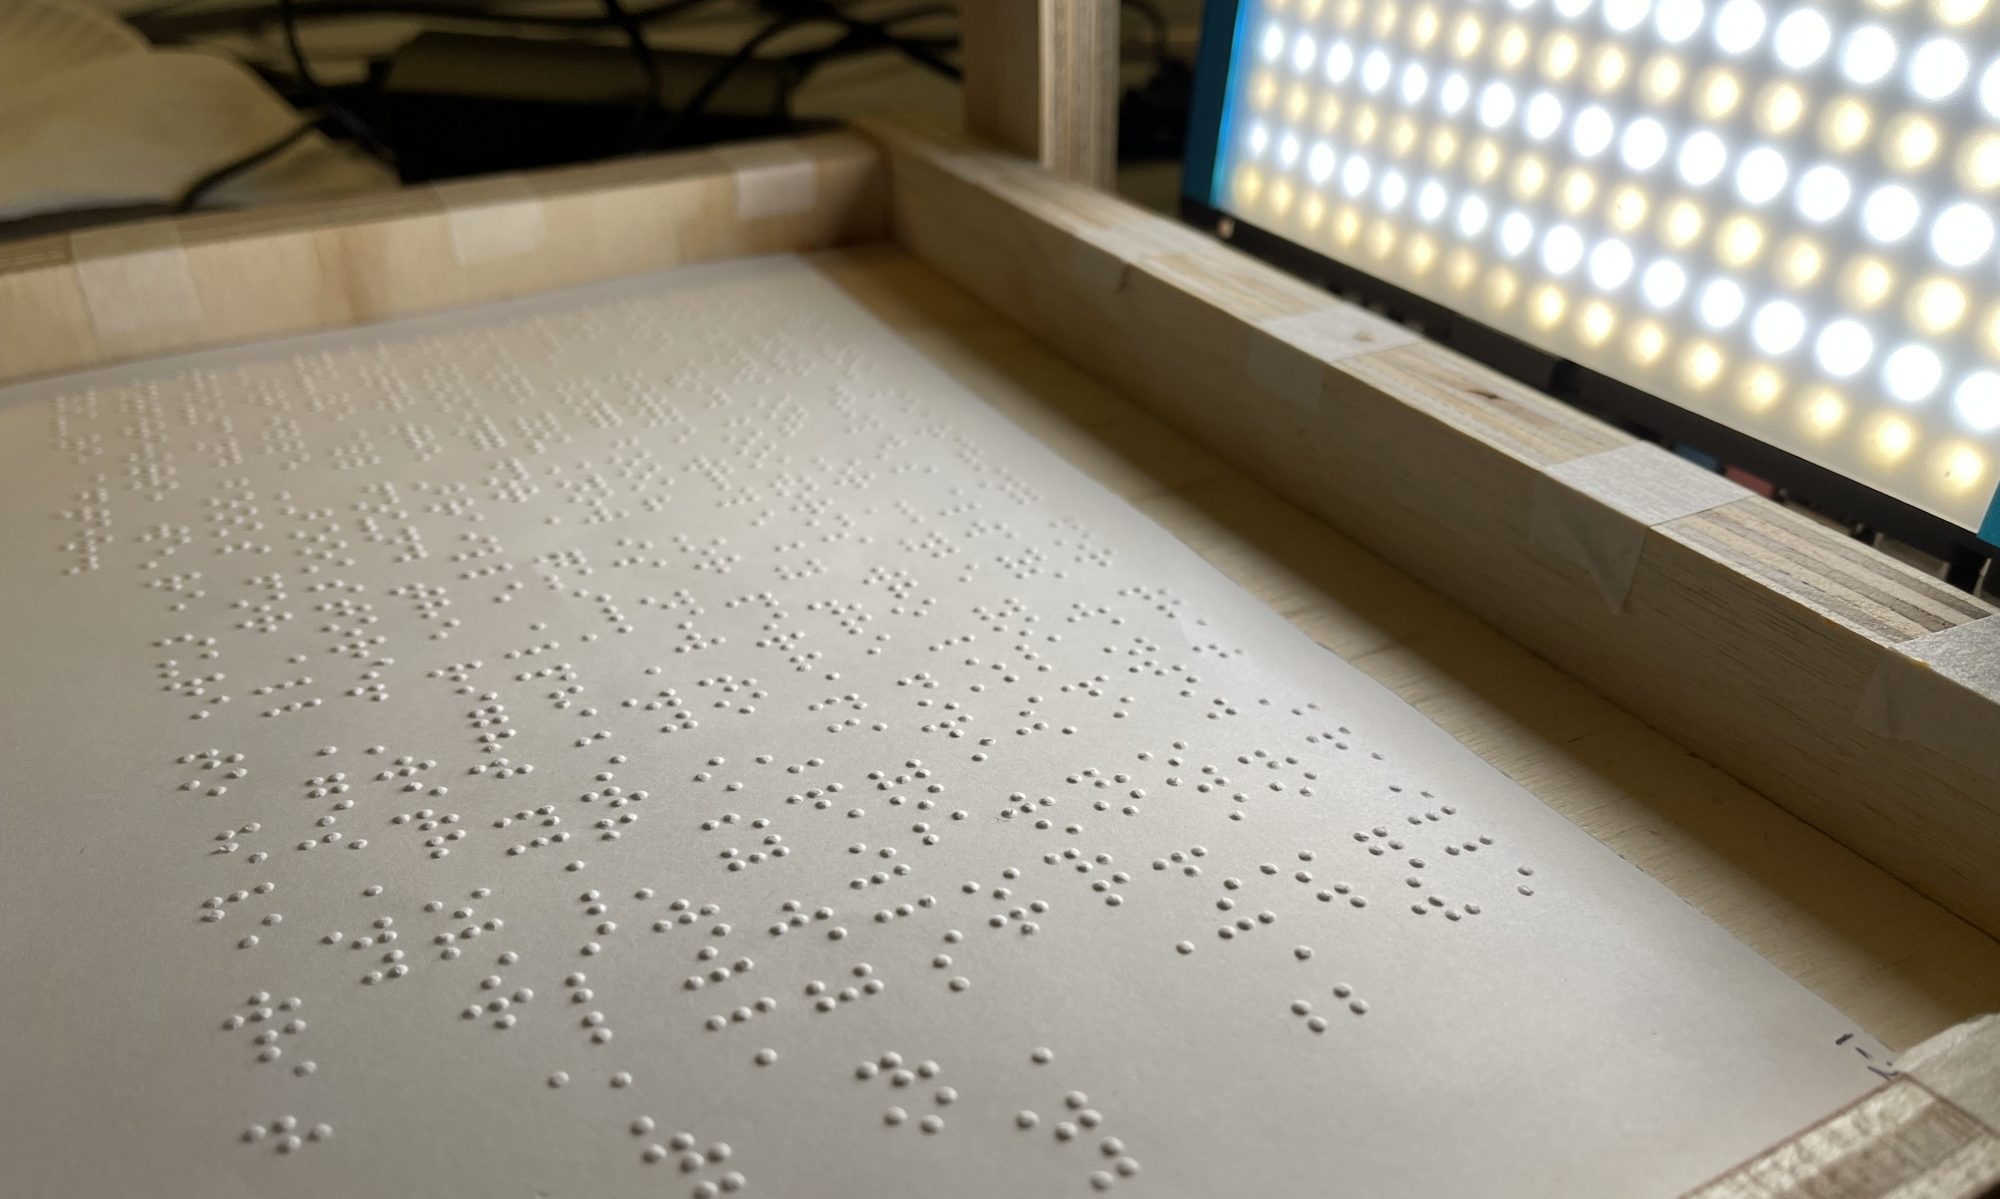
This past week (10/15), the team spent the majority of their time developing the design report, for which I spent some time performing an experiment to measure the performance of the pre-trained model we are measuring. To do this, I first had to download an offline copy of the labeled dataset made available by aeye-alliance. Then, I relabeled the dataset with braille unicode characters rather than English translations. I also manually scanned through each labeled image to make sure they were labeled correctly. Of the more than 20,000 images downloaded from online containers, I only found 16 mislabeled images and 2 that I deemed too unclear to use.
Attribution of training data will be difficult to maintain if required. We can refer to the labeled data csv files from aeye-allliance, which includes a list of the sources of all images, but we will not be able to specifically pinpoint the source of any single image.
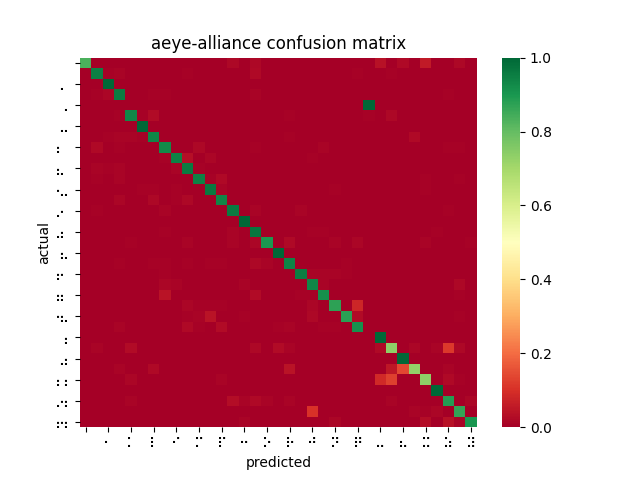
Once I had the correct data in each folder, I wrote a python script which loaded the pre-trained model and crawls through the training dataset, making a prediction for each image. The result would be noted down in a csv containing the correct value, the prediction, and the measured inference time. Using pandas and seaborn, I was able to visualize the resulting data as a confusion matrix. I found that the resulting confusion matrix did not quite reach the requirements that we put forth for ourselves. There are also a number of imperfections with this experiment, which have been described in the design report.
The rest of my time was spent writing my share of the content of the design report. The following week being Fall Break, I did not do as much work as described in our Gantt chart. I looked into how to use Amazon Sagemaker to train a new ML model and setup an AWS account. I am still in alignment with my scheduled tasks, having built a large dataset and measured existing solutions in order to complete the design report. Next week, I hope to use this knowledge to quickly setup a Sagemaker workflow to train and iterate on a model customized for our pre-processing pipeline.