Facial Recognition Accuracy
- Graph shows facial recognition accuracy vs. number of face images in database per user.
- Demonstrates that goal of 80% accuracy is achievable with 4 face images for each user, 10 are used in final product.
- Need to balance desire for accuracy vs. time needed to retrain the recognition software.
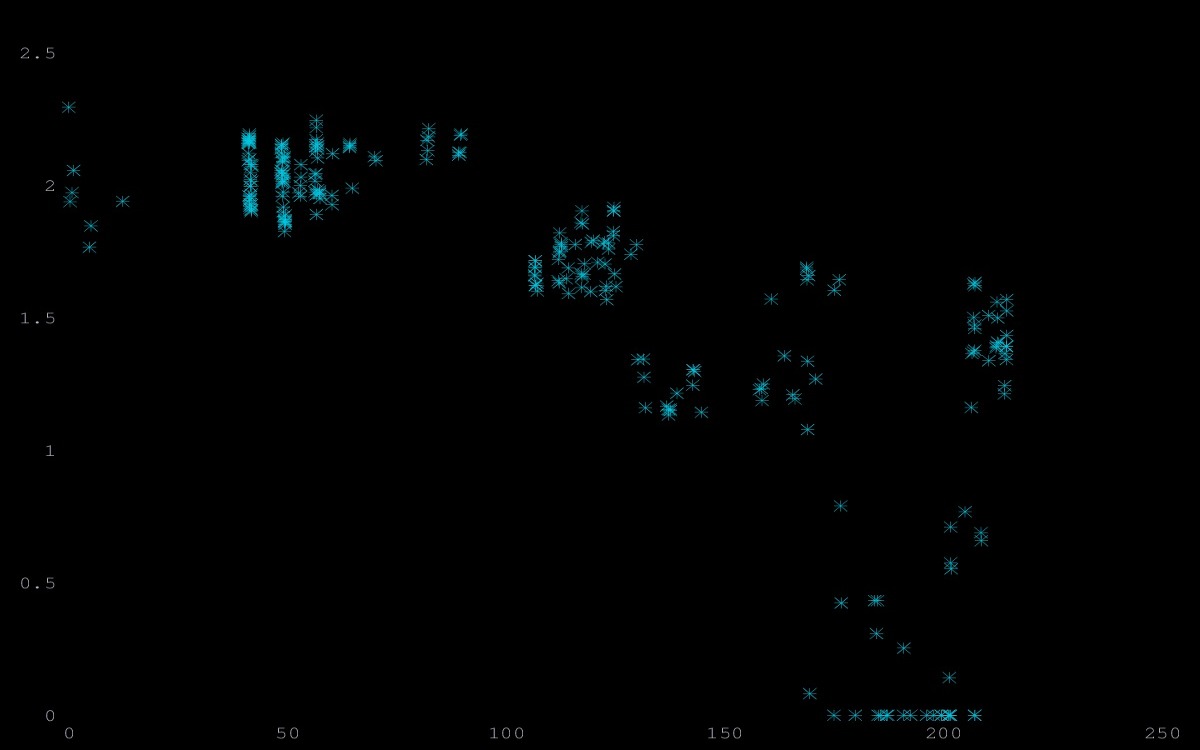
Wireless Trilateralization
- Graph shows error distance vs. time for a typical configuration.
- Error begins at goal of +/- 2 meter accuracy, improves over time as buffers accumulate data.
- Low pass filter used to reduce noise, need to fill averaging window for best accuracy.
Transmission Rate
- Graph shows time since last transmission vs. total time for an idle Android smartphone.
- Wanted to determine worst-case update frequency for the typical user carrying an idle smartphone.
- Results show that we can expect a new transmission, and therefore a position update, at least every 10 seconds even from an idle phone.