Team Status Report
The most significant risk is the electroglottograph breaking down so that we can’t use it in our live demo, but luckily we already have plenty of recordings of us using it so our final demo will not be affected either way.
A calibration test we ran for our electroglottograph is using a larynx simulator to ensure that we could read CQ data properly so that way when we put on the electrodes we could guarantee the EGG was working properly. Since our project metrics are mostly based on feel and not quantitative metrics, we ran several surveys for different users on whether or not the EGG sensors were comfortable, whether or not our application was easy to use, whether or not our tutorial page was effective, and what parts were difficult to use.
The backend has have two main unit tests
- Pitch Analysis Unit Test
- Tests the pitch detection algorithm for 8 distinct recordings of octave scales
- Includes keys: C4 Major, G4 Major, A2 Major
- Tests the pitch detection algorithm for 4 distinct recordings of “Happy Birthday”
- Includes keys: B4 Major, C4 Major, C4 Major (harmony), F2 Major
- Tests the pitch detection algorithm for 8 distinct recordings of octave scales
- CQ Analysis
- Verify that the CQ graph output from a octave scale recording of both opera singers is reasonably within the ideal CQ range. This is largely an informal test since the intent is to check that the graph is just displayed as intended, rather than trying to verify that a CQ recording is “accurate”. We might still want to consider adding this in the final report as part of our testing section? If this is the case, maybe a “passing” test is that 50% of the measurements appear within the ideal CQ range since we expect trained opera singers to have CQs that are “near” the data for trained singers reported in David Howard’s research paper.
No changes were made to the design. No changes were made to the schedule.
Tyler’s Status Report 4/26/2025
This week I spent some time working through the tutorial pages of our program that will give the instructions to the user of how to use/setup our product as well as inform them about CQ and why it is important, as well as finishing up our project poster. I also conducted some testing/recordings and hope to get the feedback soon on whether or not the tutorial was comprehensive enough and if the CQ knowledge was informative. Overall, not a ton of work is accomplished due to other commitments but luckily they will end a few days before our final demo to give me time to debug and fine tune everything.
Progress is on pace, just need to touch up the tutorial pages and then publish it to the main program which should take less than a day, will start back up Tuesday after 1pm since that is when my last class ends besides capstone. Over the next week it is just gonna be helping Melina through the video as well as working on the final report + making sure we get all the feedback from the testing we conducted.
Melina’s Status Report for 04/26/2025
Schedule
Official Project Management Schedule Updates
- IN PROGRESS Backend Testing
- DOING Pitch analysis testing
- DOING CQ change analysis testing
- ‘testing’ in this context doesn’t really make sense, but I will be visually verifying that a trained opera singer has a CQ closer to the idealized CQ range than an amateur singer
- IN PROGRESS Inform about Change in CQ
- IN PROGRESS Final Demo Video
Pitch Analysis
- DOING: test all ‘Happy Birthday’ repertoires’ accuracy
- DONE: add function to output pitch based on the mouse’s position
- If I am understanding correctly, the frontend can pass the mouse cursor’s “x_pos”, which would represent a frequency value, to the backend. The function I wrote, get_pitch_label(), takes this value and converts it to a pitch note for the frontend to display as a small label next to the mouse cursor
- Improved pitch detection accuracy to 99.49% for all scales
CQ Analysis
- DONE: add function to output values of ‘ideal’ female and male ranges
- Instead of a function, I added constants (one for female, one for male) to proc_data.py
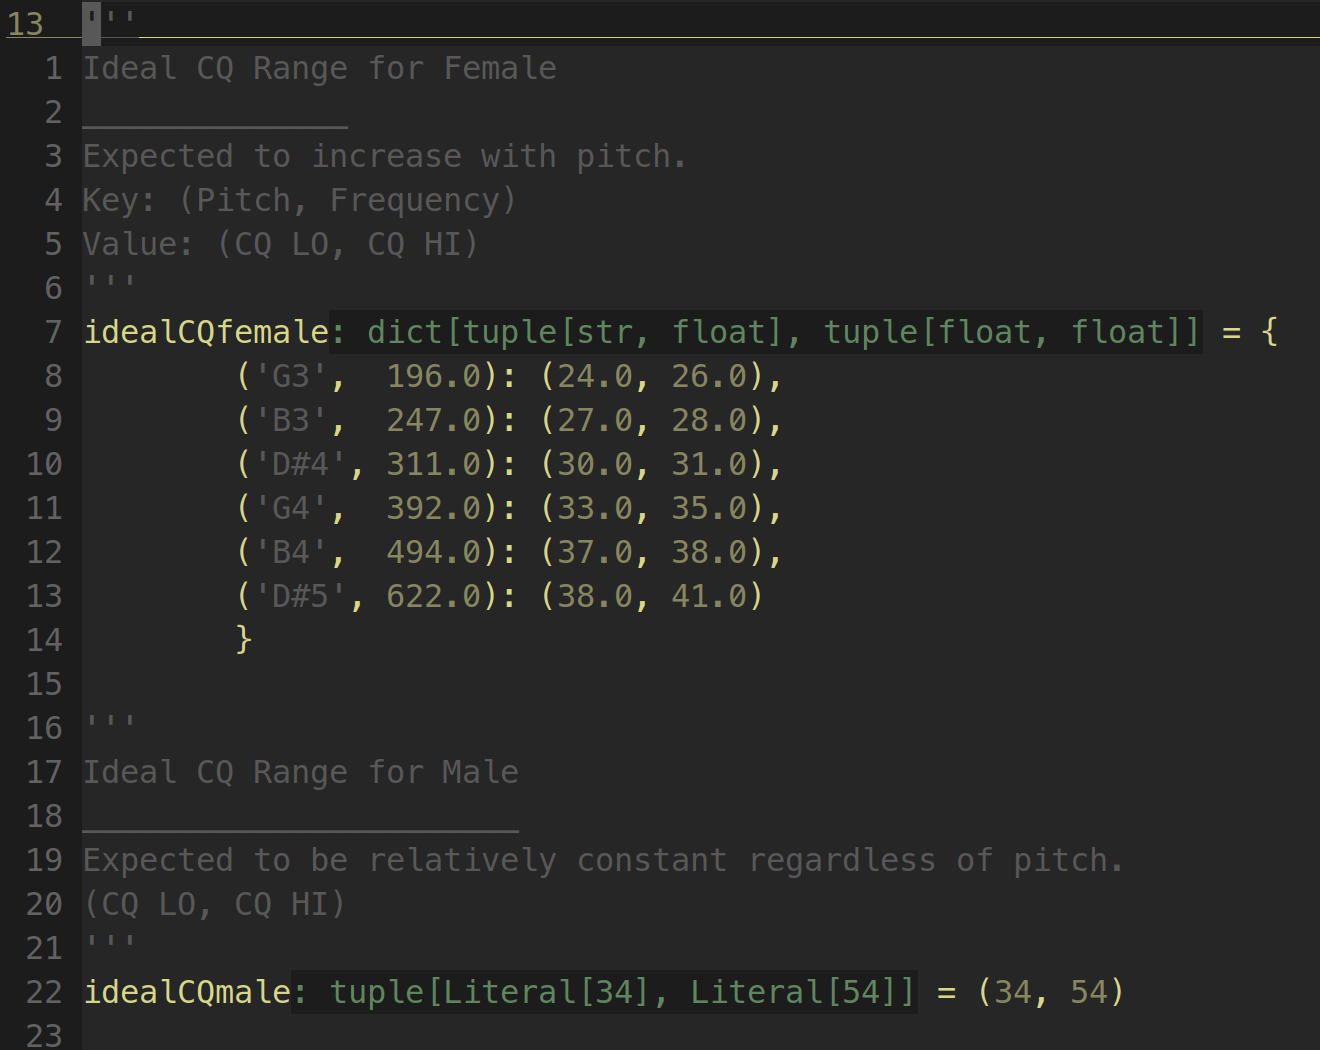
- This data was “recreated” based on the research papers by Howard. The papers summarize this data, but don’t explicitly give values for the summarized data. I had to create this summary with exact values and with slight modifications to fit our applications needs. For female data, I calculated two means (one based on all trained female singers, and a second based on only trained female singers with 10+ years of training) to compute CQ ranges. For male data, I made an executive decision to use the last session of the M1 (Male 1) test subject. The last sessions represents the recording session in which M1 had the most exposure to vocal training.
- While this tasks is computationally done, I will be meeting again with Susanna to ensure that the way I formatted the data is appropriate for the frontend to graph. I’m only concerned that because our research is limited to CQ measurements of certain pitches, that we will have to consider this when making the graph area look understandable to the reader. We can either fill in the “gaps” with a linear model, or represent only the concrete data in a “candlestick chart” style.
- TODO: Confirm ideal CQ data format with Susanna for frontend
Final Demo Video
- I recorded the footage I need for the final video
- TODO: Record video script narration
- TODO: Edit and publish video
Melina’s Status Report for 04/19/2025
Schedule
Official Project Management Schedule Updates
- IN PROGRESS Backend Testing
- DOING Pitch analysis testing
- DOING CQ change analysis testing
- ‘testing’ in this context doesn’t really make sense, but I will be visually verifying that a trained opera singer has a CQ closer to the idealized CQ range than an amateur singer
- IN PROGRESS Inform about Change in CQ
Pitch Analysis
- Adjusted intervals mapping frequency to pitch
- Added backend functions for extracting frequency given a pitch (to help with creating graph ticks for the frontend
- Tested pitch detection algorithm for all recordings of scales
- Results were 97.9% accurate
- DOING: test all ‘Happy Birthday’ repertoires’ accuracy
- DOING: add function to output pitch based on the mouse’s position over the audio player view of the pitch vs time container
CQ Analysis
- Implemented integration of CQ analysis into the backend
- I get the weighted average of every pitch-based time interval and output it into a list
- For the audio player, this list is given to the frontend along with corresponding time stamps and pitches for display
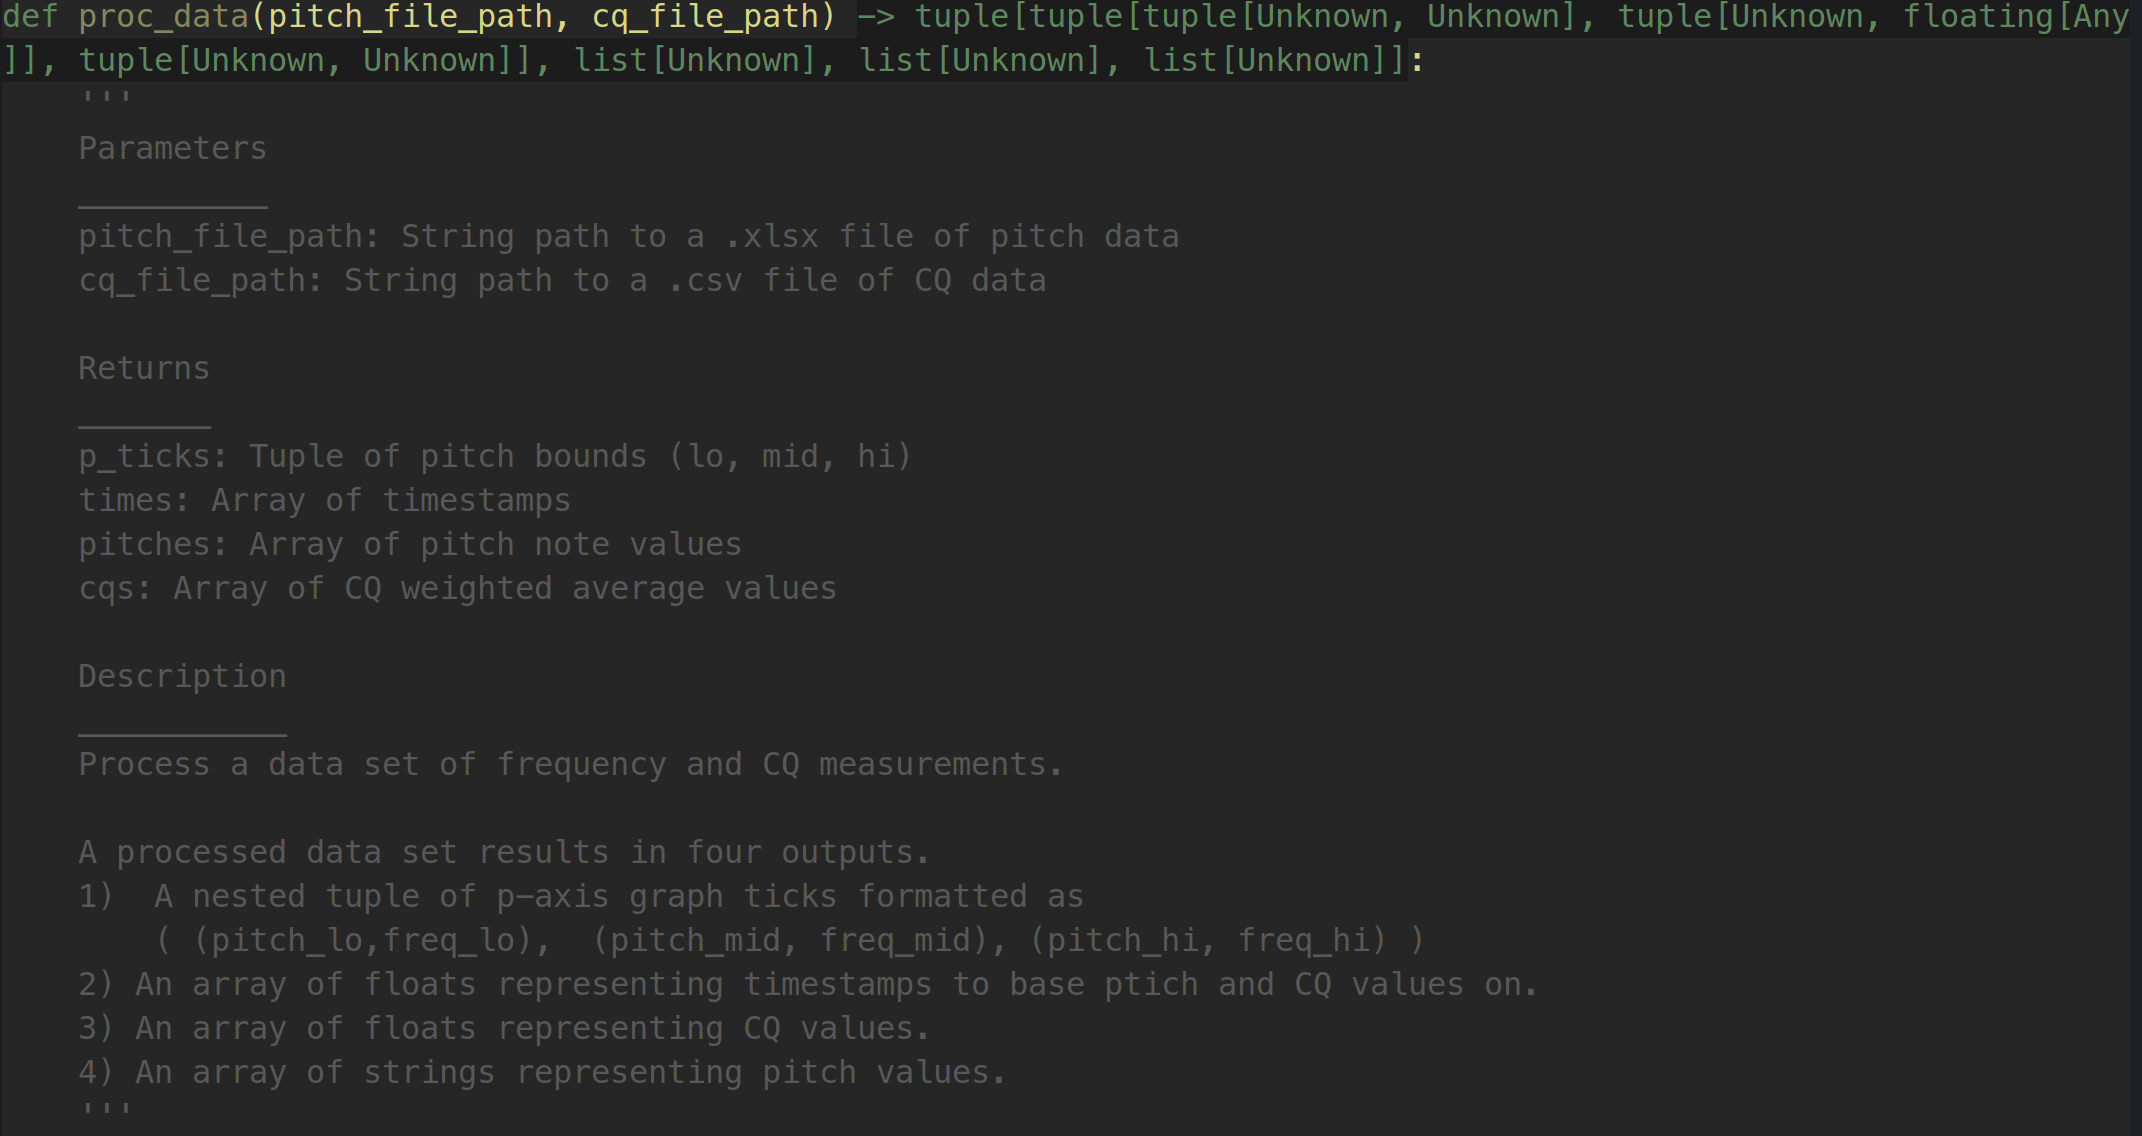
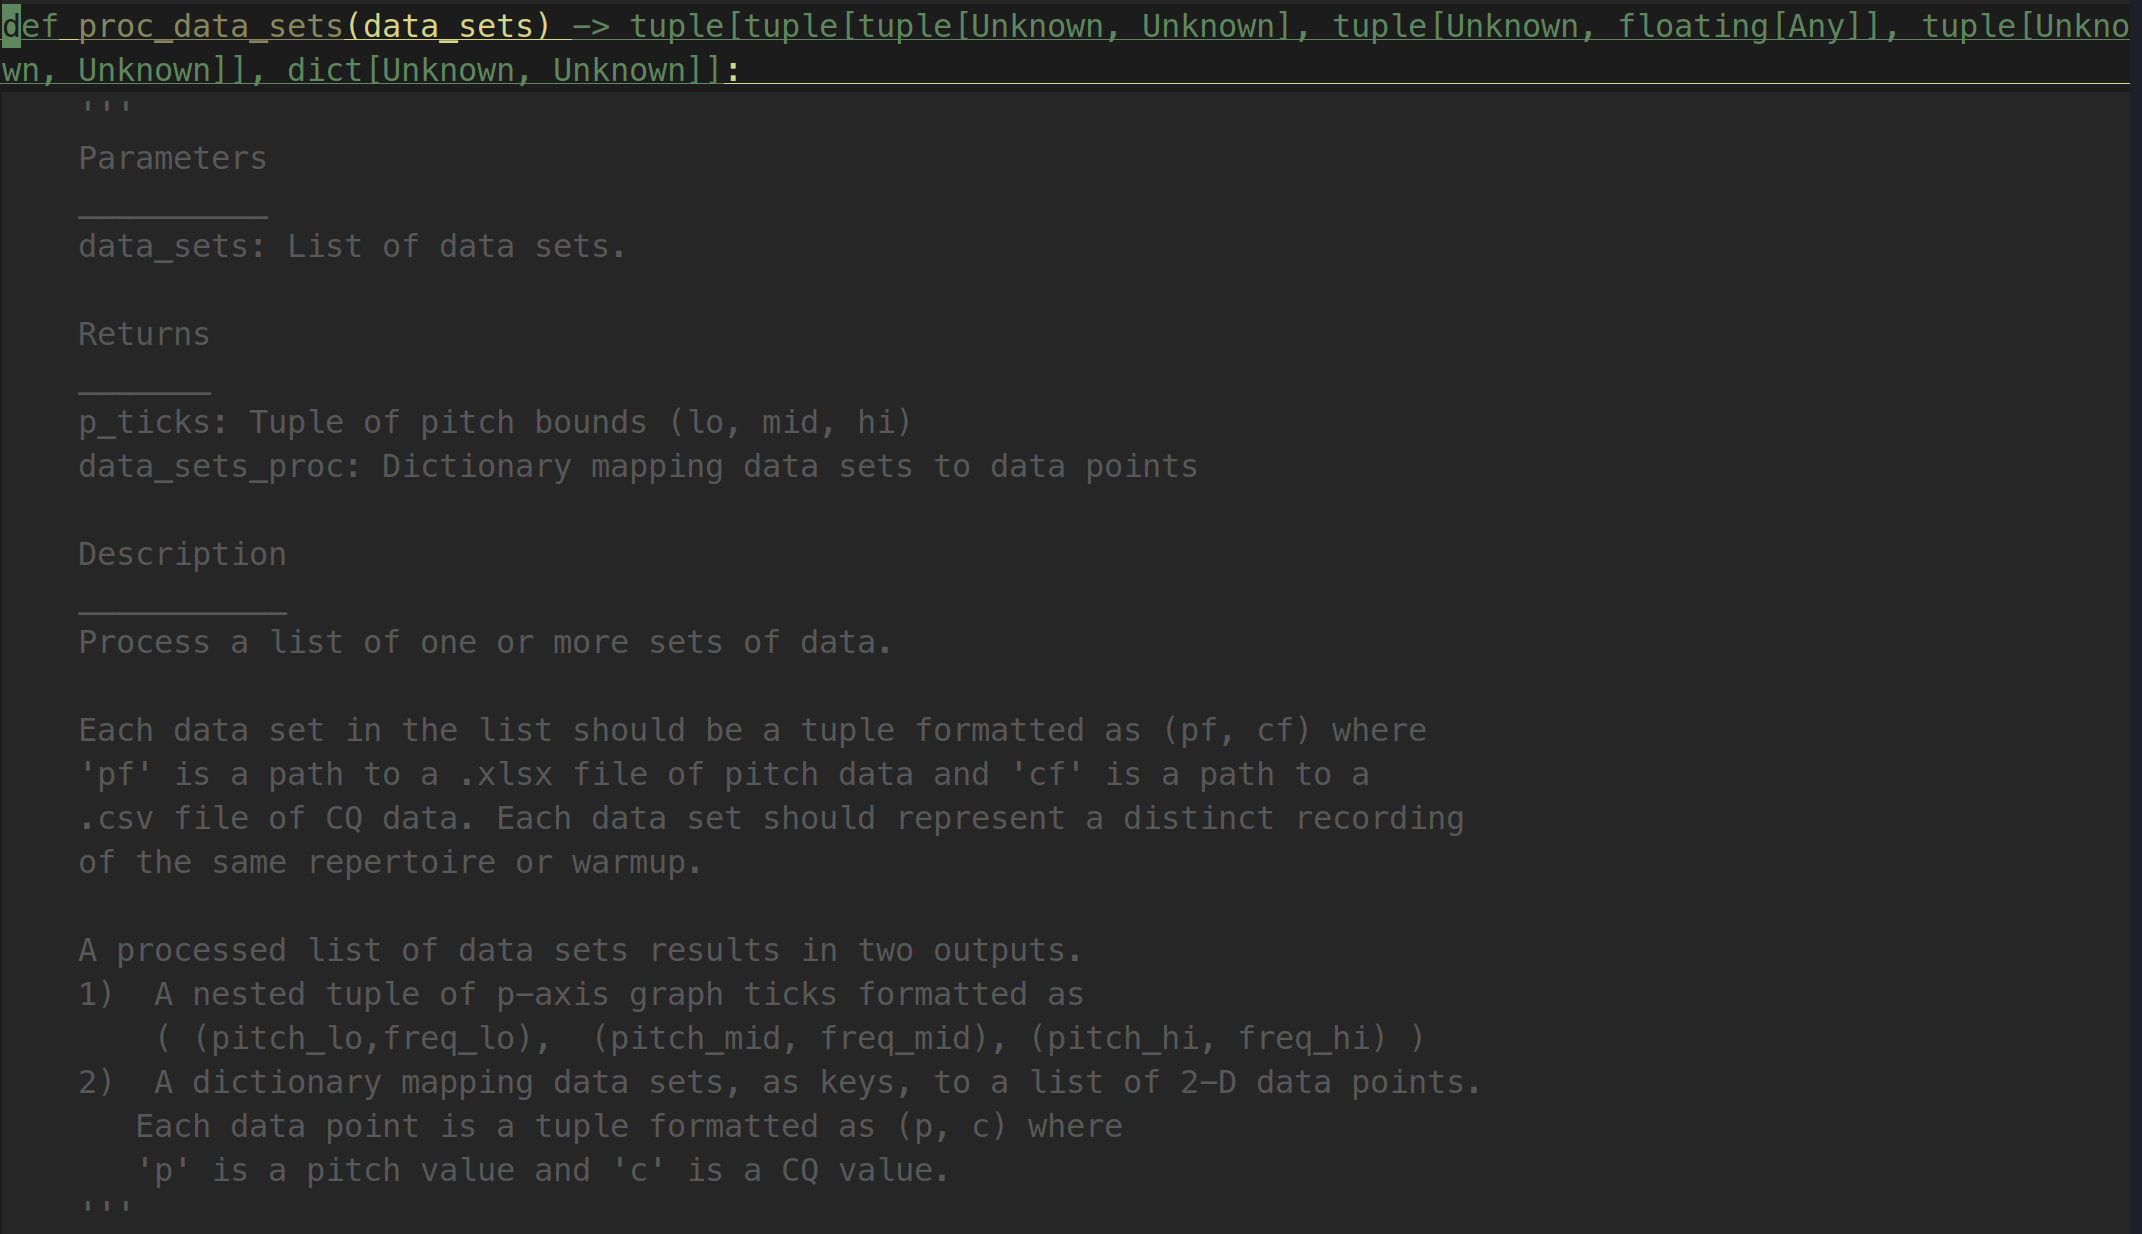
- For the graph of change in CQ over time, a function was added to process multiple data sets (representing distinct recordings) which further processes the data by mapping each recording’s distinct pitches to their averaged corresponding CQ.
Team Status Report for 4/19/25
End-to-end Product
We’re at a point where we are able to use our components to make a full end-to-end example of our workflow: starting with the recording of both an EGG signal and the corresponding audio signal. VoceVista processes both the audio file to get spreadsheets of CQ and pitch frequencies over the given interval. At the moment, we have to do much of the following processing manually in order to sync up the start times of each file, as well as the audio itself. Once these are processed and lined up, we can load them into our application. The backend will automatically make sure that the total duration is synced up, and establish the range of pitches to show on the display graph based on the pitch identification algorithm. Finally, the frontend displays all this data to the user. Unfortunately, this isn’t a particularly seamless process at the moment, since it still requires some manual processing of data, but it at least is effective.
New singer feedback
Our main collaborators in this project are the two opera singers in the School of Music who we’re working with. This week, we also completed brief sessions with three non-music-student vocalists, with the goal of further gauging how new users interacted with our application and setup. This was an extremely small sample size, but yielded some interesting results from the anonymous Google form we asked the singers to complete after their sessions. Notably, all three singers we worked with agreed that the sensors were comfortable to wear, and that the setup and the navigation of the app were straightforward. However, we also asked on a scale of 1 (strongly disagree) to 5 (strongly agree) whether “the information I gain from this application would be useful or informative to my practice as a singer.” All three of our singers reacted with 3 (neutral) to this question– they didn’t see a direct practical application of the EGG data, and seemed to expect a clear “this is good” “this is bad” feedback as to their CQ, when the reality is a bit more complicated.
This was informative to us because on the one hand, these singers were not as experienced in formal technique as our opera singers, despite their love of music, and this confirmed that our target audience is actually quite small: this application might not be the most directly applicable to a larger pedagogical setting. However, through various channels of feedback and the advice of our TA and faculty mentors, we’ve agreed that we need to do more with the CQ data that we’re gathering, since that’s really what makes our project unique. As a result, we’ve made a plan for displaying CQ data in relation to pitch, allowing the user to select multiple days to compare over time. See Susanna’s status report for more details. This will be the final main feature to implement in the final couple weeks before demo.
General Schedule
Our overall integration of components has been going according to schedule, and our EGG has not had further complications this week– there aren’t any new risks to the project as of this time.
Susanna’s Status Report 4/19/25
Revisiting last week’s goals:
- Use real EGG output data on playback page
- Done– we took more recordings with our vocalists, and put the real CQ, pitch, and audio signal into the playback page– after taking a number of steps to synchronize all three of these files

- Implement basic repertoire library page
- Done– the library allows the user to mark each recording instance with the song it’s related to, the name of the recording, and the date. The final column in this table allows the user to open up the playback view for the given song. I implemented a sqlite database with two tables (one for songs and one for recordings, with a one-to-many relationship between the songs and the corresponding recordings)

- Additionally, I created this “Add Recording” page where the user can create a new recording instance to add to this table, and can select the corresponding files to display. Additionally, the user can create a new song to link the given recording to.

- Complete one data analytics view
- Done – We added the view for seeing pitch on playback (as you can see under the first point), including the visual graph and the names of the pitches.
Next Steps
- Pitch vs CQ view
- The final feature to complete for the app side is a CQ over pitch analysis. Basically, the x-axis displays pitches, while the y-axis displays CQ. Multiple recordings from separate days can be loaded, to view the average CQ for the given pitch for each recording selected.

- Testing & verification
- Full integration with the backend
As you’ve designed, implemented and debugged your project, what new tools or new knowledge did you find it necessary to learn to be able to accomplish these tasks? What learning strategies did you use to acquire this new knowledge?
The main technology I had to learn for this project was, of course, the DearPyGui framework– I hadn’t programmed a Python desktop application since 15112, so I didn’t have much background to work off for this particular task. DearPyGui is a more obscure framework, chosen for its particular GUI features for things like graphing. However, this obscurity was a large downside to the framework, because learning resources were limited. I mostly used the DearPyGui documentation website, as this featured comprehensive explanation of components and functions, as well some limited examples. For more obscure glitches, I turned to the DearPyGui Reddit and Discord pages. Because of the small amount of resources, I had to do a lot of extrapolating from limited information to use in larger contexts. For instance, I wasn’t at first sure of how to create a multi-page display system within DearPyGui: I got information from these resources as to how to code the individual components for each page, but I created my own system for switching from page to page (creating a class for each page within the app, plus an app manager class) as the examples didn’t have that much detail.
Tyler’s Status Report 4/19/25
This week I primarily focused on collecting and transferring all the data we collected in VoceVista into a useable excel spreadsheet for Melina and Susanna to use. Since our electroglottograph dual channel feature for the microphone and EGG signal is not working, I have to record the audio from a different computer, send it my computer, and manually align it with the EGG signal data. On top of that, I have wrote up a tutorial for new users to follow to use our product, and am now working to implement that into our frontend. That has involved me learning a little bit of PyGUI but it has been relatively straightforward.
So far progress is on track, I want to finish up the tutorial page by this weekend and for next week be able to work through adding an overarching guide on how to read the CQ data as well as what takeaways there are from the data. So far, all we do is output the CQ data and leave the interpretation for the user, and while it is impossible to give hard truths for CQ data I want to write out a guide for general trends to see how you compare to the “industry standard” for opera singers.
Several things that I had to learn in order to complete our project is how to use VoceVista, how to use an electroglottograph, a little bit of excel spreadsheet work, and learn a few different python libraries such as pytesseract or DearPyGUI. The primary learning strategy I used for VoceVista was by using their online video tutorials to get everything initially set up and then emailing the author’s of VoceVista any miscellaneous questions I had afterwards. For the electroglottograph, I primarily relied on the manual that came with it but that led to several issues, but luckily I was able to get in contact with the manufacturers of the electroglottograph that we are using to fully utilize the electroglottograph. With the python libraries, since DearPyGUI is not well documented I primarily asked Susanna questions I had with using it since she had been using it all semester. With pytesseract I primarily looked at other coding examples similar to what I needed and followed their template of how to utilize the library.
Melina’s Status Report for 04/12/2025
Schedule
Official Project Management Schedule Updates
- IN PROGRESS Backend Testing
- DOING Pitch analysis testing
- NOT STARTED CQ change analysis testing
- IN PROGRESS Inform about Change in CQ
Pitch Analysis
There have been delays in receiving most of the pitch data from this week for testing. One important recording, C Major Scale by one of our opera singers, was obtained and testing yielded ~97.83% accuracy. This task is a little behind, so I will be following up with the team to get access to more crucial tests, such as Happy Birthday.
CQ Analysis
Currently the program now extracts CQ values at timestamps that correspond to the time a given pitch is from. The next step will be to implement a way to choose a set of CQ data based on an identifier (such as the name of a repertoire or the key of a scale for “name-less” warm up recordings). The idea is have a system that allows the front end to pass in these identifiers and receive the clean sets of data to pass on to DPG for graphing.
I conducted interviews with the vocalists this week to gain a better understanding of what changes in CQ they would find helpful to know about. The main takeaway was that they would like help in identifying “flutters” and “wobbles”. I am currently working on understanding how a CQ measurement might indicate one of these problems. There do not appear to be research papers on this specific topic, but if we take CQ measurement recordings of these problematic samples and compare them with ideal samples, there may be a pattern we can discern.
Regarding the issue with collecting audio and EGG signals at the same time, I have proposed transferring ownership of the Voce Vista access key to my computer which has a USB-B port that may solve the issue. Unfortunately, this might mean limiting Tyler’s ability to collect data. For the time being, we have decided to focus on implementing the first upcoming task mentioned in this section so that the front-end has something tangible to demo for the vocalists.
Susanna’s Status Report for 4/12/25
Revisiting last week’s goals
- Use sample data to more clearly demonstrate the layered table rows in the playback view (for interim demo)
- Done– there were some glitches here that I wasn’t expecting, but I basically just added a sine wave overlaid with the original audio signal. Tyler is working on syncing up our audio signal and EGG signal from our singer session on Thursday of this week, and once that’s complete I’ll simply use the average CQ data as the graph here instead.
- Enable cursor scroll
- Done– oddly, the most challenging part of this was getting DearPyGui to make the separate cursors have proper their colors. This step is easier shown than talked about, so check out this video if you’d like to see the cursor scroll in action!
- Expand page menus and navigation
- Partially done – This is sort of a vague task and I should have fleshed out more of what I was expecting it to encompass. I have created menus to link to the different instructional/playback pages, but since those pages aren’t completed yet, it’s not much of an accomplishment to note here.
- Hammer down specific parameters for data analytics views, and complete one view (eg, average CQ over time graph) using arbitrary sample data
- Partially done – Melina and I worked on establishing explicitly what we want some of our data views to look like, particularly with allowing the user to view multiple CQ waveforms simultaneously and specifically how to display CQ per pitch over time.
- Partly still in progress – I haven’t actually coded the sample view itself. It’s a bit of a chicken and egg scenario between gathering data and coding data views, but I was hesitant to dive in head first as I don’t actually know what form the pitch data will look like once Melina has processed it.
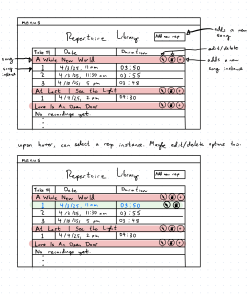
Repertoire Library Wireframe
Additionally, I worked on the actual flow of the application as the user navigates it, with some help from our School of Music friends, since we realized that some of our initial plans were a bit hand-wavey. Specifically, how do vocalists view their library of repertoire that they’ve recorded and navigate it easily, especially given that this is a key element of what sets our application apart? My solution was to sort the repertoire at the high level by the title of the piece, and then at a lower level by the date each instance was recorded. Perhaps this is another case where it’s easier to see what I mean than for me to try to describe it. This is the Repertoire Library view, where clicking on each recorded instance will open up the Playback View that we know and love:
Verification
Our verification testing for the frontend will be done manually. My main goal is to ensure that the playback page functions given various parameters (files that have varying lengths, files that are missing either the EGG signal or the audio signal) and that unexpected inputs are handled gracefully with the app’s error handling. Specifically:
- Input 5 songs of various lengths. Successfully play through, replay, and scroll through each song.
- Input 2 songs without EGG signal. Successfully play just the audio.
- Input 2 songs without audio signal. Successfully view the signal without playing audio.
Goals for next week
- Use real EGG output data on playback page
- Implement basic repertoire library page
- Complete one data analytics view