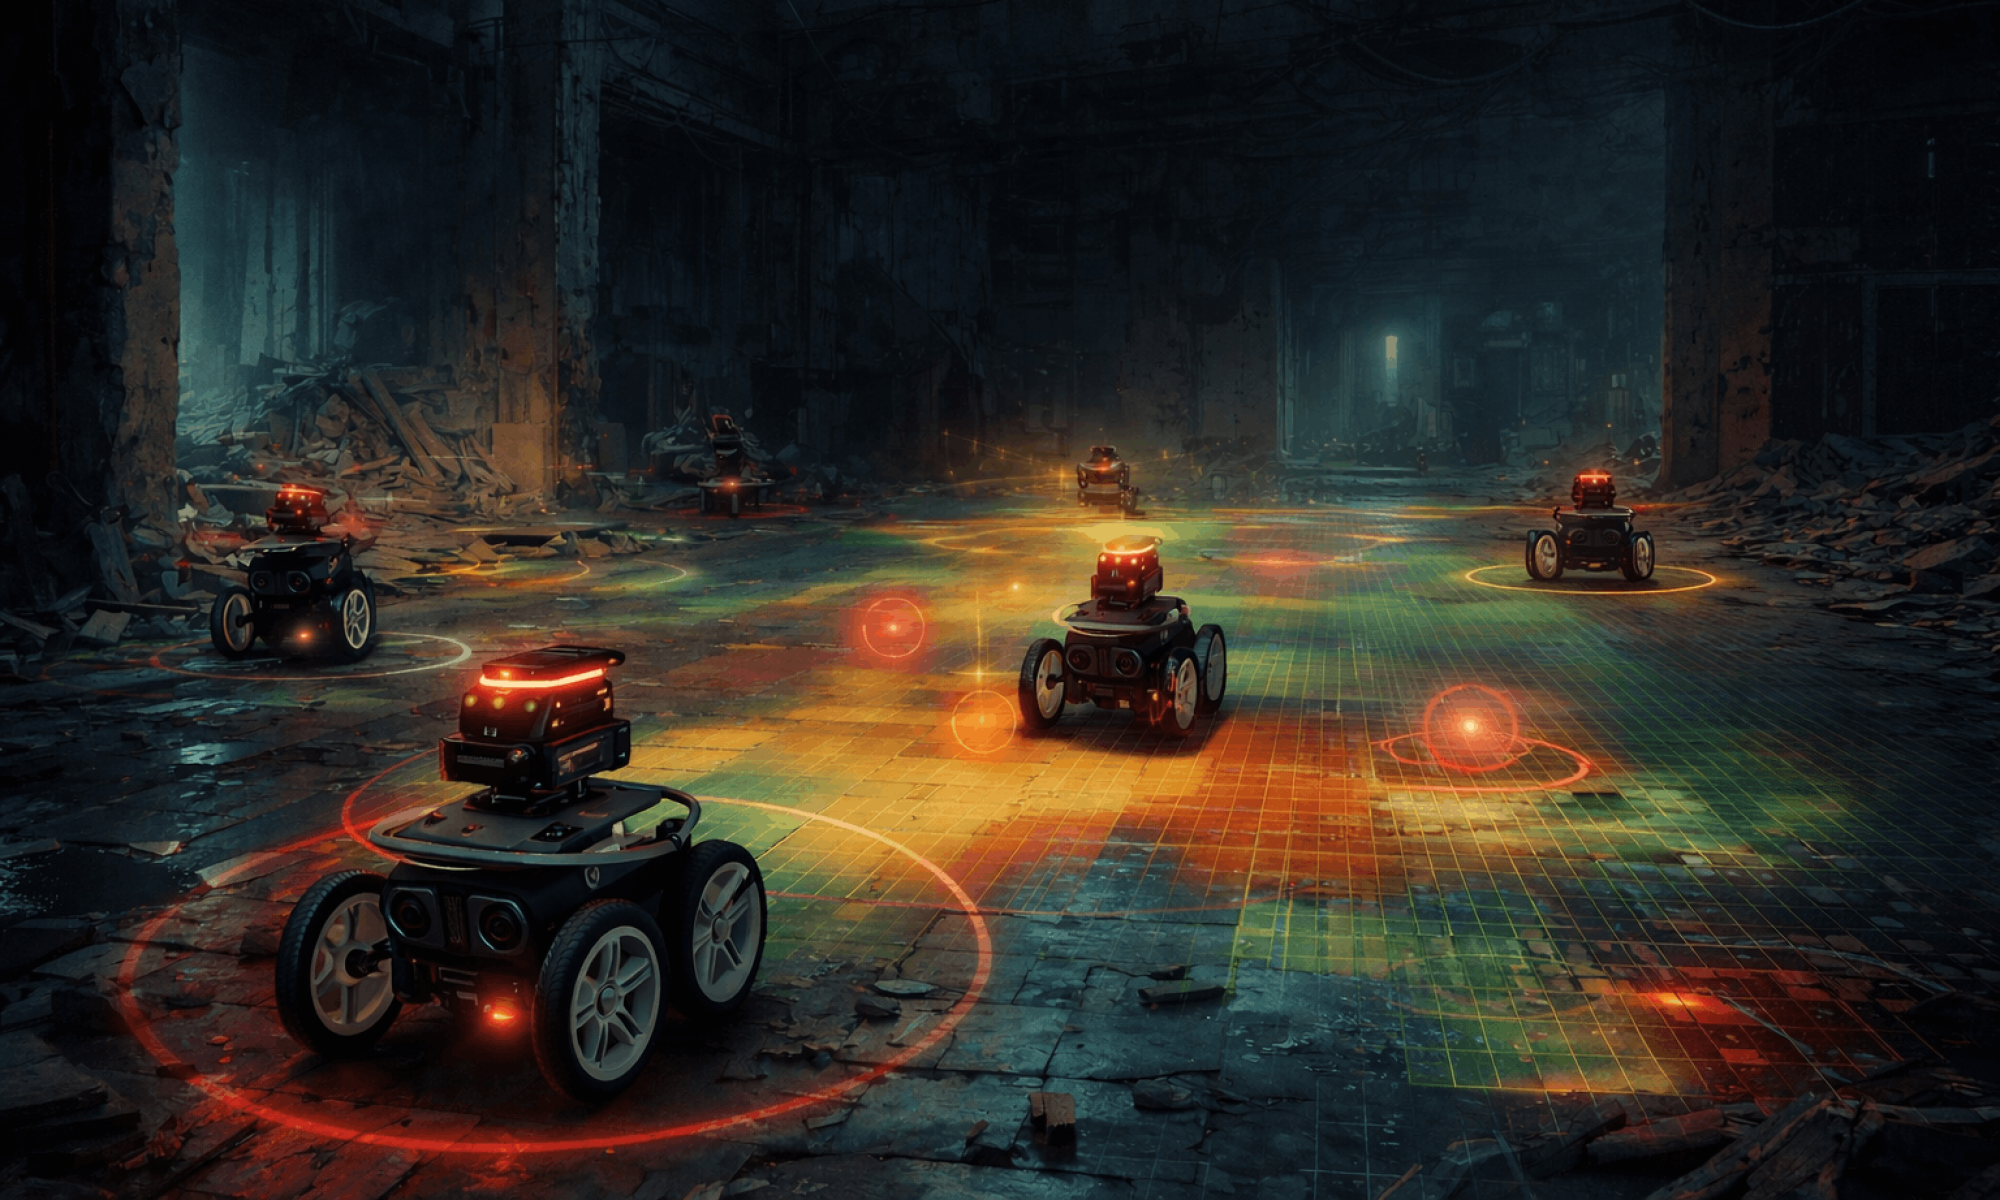
This week, I translated the UI requirements and data schema outlined last week into a functional interactive prototype with the use of Cursor.
The four operator questions from last week drove every design decision:
1. Where exactly have we searched?
The “spheres” concept from last week became a 2D sparse occupancy grid overlaid as a color heatmap directly on the map canvas. The map is divided into 2m × 2m cells, and every time a bot passes through a cell its visit count increments. The heatmap shades from dark green (lightly visited) through yellow-green to amber (heavily covered), giving the operator an immediate sense of search thoroughness and gap areas without any SLAM computation. This is purely positional history — lightweight and fast exactly as intended.
2. Where do we suspect the target is?
The global map view centers on the operator’s position as the origin. All bots are rendered relative to that anchor with live position updates. Target detections appear as pulsing red markers directly on the map at their reported (x, y) coordinates. I also added proximity halos around each bot — a color gradient ring (red when far from any known target, shifting to green when nearby) that gives the operator an at-a-glance sense of which bots are closing in on a detection.
3. Are the bots healthy and coordinated?
Rather than a hover tooltip, I implemented a persistent fleet status sidebar that keeps all bot health data visible at all times without requiring interaction. Bots are grouped into named clusters (Alpha and Beta) in collapsible accordions. Each bot card shows its ID, status badge (Searching / Returning / STUCK? / Idle / Lost), a color-coded battery bar with percentage, its assigned role (Scout / Anchor / Line / Relay), and its live coordinates. If a bot enters a STUCK? state the card highlights in red and a blinking indicator appears. The cluster accordion header also shows average battery and flags the cluster immediately if any bot is stuck, so the operator can triage quickly.
4. What should be done next?
The target alert payload schema from last week is fully implemented. Each alert carries a map location (x, y), confidence score rendered as HIGH / MEDIUM / LOW with color coding, and a sensor rationale string (e.g. “RF/UWB reflection detected”). When the operator clicks a target marker on the map, a popover appears with the full payload — location, confidence meter, rationale, and timestamp — along with an ACKNOWLEDGE action to clear it from the active alert queue. Unacknowledged targets accumulate a badge count in the top bar, so nothing is missed even if the operator is focused elsewhere on the UI.
At the beginning of the mission, all 7 bots have just entered the search corridor, and the occupancy heatmap is starting to form as a small green cluster in the right portion of the map. The sidebar shows all bots are healthy at 70–83% battery. No targets have been detected yet, and the top bar target counter reads zero; the operator controls are fully available.

Few minutes later, the bots have covered over 800 cells and have triggered 9 unacknowledged target alerts. The operator has clicked a target marker on the map, opening the TARGET DETECTED popover. It displays a MEDIUM confidence score of 77%, the precise map coordinates (X: 58.4m, Y: 21.0m), the sensor rationale (“Audio Anomaly Detected”), and the timestamp of the detection. The operator can ACKNOWLEDGE to log and dismiss it or Dismiss to close without recording. This directly demonstrates the actionable intelligence payload defined in last week’s schema.

Later on, the heatmap has grown to cover the majority of both the base room and the search corridor, with warm amber tones indicating areas of dense revisitation and the characteristic green-to-amber gradient showing thoroughness at a glance. Nineteen target markers (all unacknowledged) are distributed across the map as pulsing red rings. Bot trail lines are visible as faint white streaks showing each bot’s recent path.

On the performance side, the simulator and rendering pipeline run at approximately 3 Hz (333 ms tick), sitting comfortably within the 1–5 Hz target refresh rate defined last week.
Progress is on schedule. The mockup and initial implementation milestones are both complete.
For next week, the priorities are to begin the process of replacing the mock simulator with a live WebSocket or ROS bridge to ingest real bot telemetry, implement the SET BOUNDARY geofence drawing tool on the map, and begin stress-testing the refresh pipeline with the actual number of bots and update frequency we expect from hardware.


