Carter’s Status Report for 4/27/24

This week I had to spend some time debugging issues with fully integrating the forecasting models into our web app. After working on those issues, I’ve started focusing on the web app design and implementation of certain demo features that we want ready for Friday. Currently, the web app lacks dynamic and interactive elements as well as good examples to show the extremes of our tool, so I’m working on creating some preset scenarios that users could choose from. These include scenarios like “hot, sunny day” and “cloudy, windy day” and “christmas” to show how loads, renewable energy generation and the grid optimization are affected by external features.

For next week, I plan to contribute to the poster, video and final report. I’ll also spend some more time working on the front end for the forecasting statistics tab to add any visualizations that might be interesting.

Carter’s Status Report for 4/20/24

I spent this week verifying that our forecasting models are fully performing at the level we expect and are fully integrated into the overall system. In addition, I’ve spent the latter half of the week working on our final presentation, since I will be giving the presentation next week.

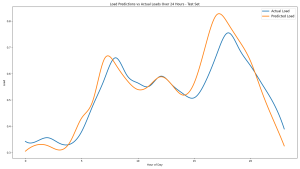
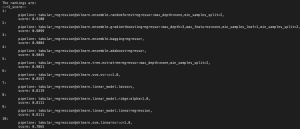
For my models, I ended up moving to a simpler architecture (random forest) for all three of my models, which has produced the best results so far. All three of my models are now achieving the goal of NRMSE <20%, including load which was the most difficult dataset to manage. After coding the pipelines for each model so that our web app can call one function to generate predictions for a given location, I also spent some time visualizing trends in our results through graphs with matplotlib, which are useful for verification purposes and to display in our final presentation. I attached an example below for reference, showing the similarity in hourly trends for our loads predictions and actual loads from our test dataset.

Next week, besides giving the final presentation, I will be focused on ensuring our web app interface is completely ready for demo.

Question: As you’ve designed, implemented and debugged your project, what new tools or new knowledge did you find it necessary to learn to be able to accomplish these tasks? What learning strategies did you use to acquire this new knowledge?

I had to learn a significant amount about energy management systems and specifically renewable energy in order to understand how to model them for our project. This mostly consisted of reading through online research papers about renewable energy forecasting to understand the concepts and methods used in the past. I also had to review and learn more about machine learning concepts I had learned in prior classes, which meant looking back at work I’ve done in those classes.

Carter’s Status Report for 4/6/24

I spent this week working on fixing issues we encountered during the integration of our three subparts as well as trying new methods for training my models that show better results than my previous methods.

Focusing on the model improvements, I was able to use the rankings provided by the Auton Lab’s AutoML tool to select Random Forest Regression as a more effective model for our wind data than LSTMs were. I was also able to discern the most effective preprocessing steps to take as well as optimal hyper-parameters, all of which i used to write a new python script for training and predicting on a random forest regression pipeline. This method achieved impressive results in terms of testing metrics, with an R^2 score of 0.922 and a NRMSE of 9.8%, the best scores we’ve gotten yet and well under our goal for this project. Next week I plan on using the AutoML tool to analyze our load and solar data as well and see if a better model can be used for each of them.

In terms of verification for my portion of the project, I’ve been utilizing Sklearn’s evaluation modules (mean_absolute_error, mean_squared_error, r2_score, etc.) to record metrics for every algorithm I try in my modeling of power data. These metrics are outputted for test data, which is unseen by the model during training to avoid data leakage. In addition, these metrics are compared with the linear regression metrics I generated at the beginning of this project, to ensure improvements have been made. In the absence of a ground truth for predictions made using future weather forecasts, I ensure manually that my results follow a logical trend over time (i.e. solar increases in the day and decreases in the night).

Team Status Report for 3/30/24

Risks

Our models are currently not exhibiting real world behavior closely enough and we plan to improve upon their performance in the coming weeks.

The multi-period solution trajectory is slow to converge and doesn’t show correct behavior for multiple test scenarios, therefore there is a risk that the optimizer has some deep structural issues that may not be solvable within the schedule.

System Changes

We’ve decided upon our basic visual layout for the final webapp. Which will include some sample scenarios (i.e. winy day, cloudy day, etc.) as well as a slider to travel through time. The SUGAR optimization codebase was migrated into a submodule to cleanup the overall file hierarchy.

Schedule Changes

We are mostly on schedule. Integration has taken a bit longer than expected so more work will need to be done next week to improve upon models and visuals

Carter’s Status Report for 3/30/24

This week was focused on integrating the components of our project in preparation for the demo next week. For my forecasting models, this meant I had to ensure that my trained models were outputting consistent and reasonable predictions given current weather forecasts. To make this easier, i created a main file with three functions (one for each of solar, load, and wind forecasting) with each function taking in a location and returning the respective predictions in a pandas dataframe, indexed by hour. This way the web app and the optimization solver and access the forecasts from one place.

For next week, I’m looking to seriously improve the performance of my models, since the load and wind predictions seem to be especially overfitting. One idea that I’ve started experimenting with is using an autoML tool which I’ve been helping develop as part of my research at the Auton Lab. I’ve already run our wind data through this autoML system and identified some models that achieve better results than our current LSTM. A ranking of these models by test R^2 score can be found at the bottom of this post.

Carter Weaver’s Status Report 3/23/24

This week I focused on properly structuring my codebase for ML forecasting and developing a pipeline for our three training datasets (load, solar, wind) centered around a simple lstm model. Code refactoring involved modularizing my data preprocessing, model training, predicting, and writing outputs to files. This made it much easier to share functions across python scripts so I could easily extend my LSTM training code.

The current LSTM model is performing well for the wind and solar data NRMSE of 11.3% and 11.0% respectively. The results for the load data, however, are not yet good enough and it appears to be resulting from overfitting, which I plan to fix this weekend.

Overall I’m making good progress, but I’m a bit behind considering I planned to begin integrating my models with the optimization and web app this week. However, we plan to put together our components beginning next week and I expect to have all my models outputting relatively accurate predictions in time for the demo.

Carter Weaver’s Status Report for 3/16/24

This week I worked on the actual development of my forecasting tools. Firstly, I was finally able to access a large and reliable enough dataset for load measurements from a selection of residential homes in the UK. Another data collection decision I made was to purchase a bulk download of historical weather data from 2013-2023 off of OpenWeatherMap for training purposes. The download consists of three datasets for three locations relevant to our solar, load, and wind datasets: Pittsburgh (US), Loughborough (UK), and Yalova (Turkey). 

As for code that I contributed to our repository, I started with some data preprocessing by extracting cyclical information from DateTime objects, such as days of the week, as features for our model to make more informed predictions. With the load data and supplementary weather data downloaded, I was able to finish all of my linear regression baseline models, all of which showed very bad results as expected.

Finally, I started experimenting with fitting our wind data to a simple lstm, which I got from Tensorflow’s Keras API. This is already exhibiting better results than our basline model, which is encouraging. Next week, I hope to have a simple lstm working for all of our datasets and then begin integrating the models with our webapp and optimization tools.

Team Status Report for 3/9/24

Risks

  • There is still uncertainty about the reliability of weather forecasts and the consistency of OPF convergence so backup/default outputs will be implemented to keep our web app simulation running smoothly.

System Changes

  • Redefined error goals for forecasting to NRMSE < 20% and NRMSE <15% to more closely align with previous literature.

Schedule Changes

  • None.

Please write a paragraph or two describing how the product solution you are designing will meet a specified need…

Part A. Written by Carter

Our tool has the potential to impact energy solutions worldwide. Electricity grids are globally utilized and microgrid technology as a more reliable and sustainable method of energy distribution is growing rapidly all over the world. Therefore, the tools necessary to control and predict for these microgrids is needed everywhere. In addition, weather patterns and energy availability varies greatly between different countries and regions of the world, so tools like Sugar-DB that can adapt to those changes and make predictions based on local data are needed globally.

Part B. Written by Carter

The need for reliable and sustainable energy is shared across all cultures in our modern, globalized society. Despite disagreements between different groups about the threat of climate change and the degree to which fossil fuels are culpable, the increased accessibility and economic efficiency of renewable energy can only benefit the people and the planet.

Part C. Written by Carter

A main goal in creating our simulation tool is to make renewable energy generation easier to predict and optimize around, given changing weather conditions and energy demand. This will hopefully encourage greater integration of renewable energy sources in the microgrids we already have, as well as the creation of future microgrids supported by renewable energy as well. Scientific evidence suggests that electrifying our grids and relying more on sustainable energy rather than fossil fuels will slow down the effects of climate change and potentially save natural resources that are at risk of rising sea levels and unpredictable weather patterns. Thus, our tool is designed to promote earth-friendly energy management which has the power to save lives and save the earth from climate change.

Carter’s Status Report for 3/9/24

The week before we left for spring break, my work for Sugar-DB focused mostly on our design report. As the designated project manager that week, I took on a lead role in the development of the report. This meant that, along with the subsections dedicated only to our forecasting design, I also wrote many of the general sections which applied to our entire project and handled most of the formatting of the document.

In the process of putting together this design report, I looked deeper into previous research and even found new sources that helped me narrow down our goals for the future and change some of our assumptions for the forecasting models. As a result of this research, I plan to focus my efforts after spring break ends on programming a working LSTM model, that can be fine-tuned and generalized to all three data pools (wind, solar, load). I plan to start with wind modeling, given the relative simplicity of the dataset.

Team Status Report for 2/24/24

This week, we were able to speed up convergence times for our optimization, Outputs baseline metrics for our renewable energy forecasting, and further design our web app visualizations.

Risks

  • Our chosen Weather API was revealed to have more restrictive paywalls than originally anticipated, but other options are proving to be useful
  • Optimization is currently converging but could not in the future due to updates to SUGAR

System Changes

  • Forecasting models will not be able to use real world feedback from the simulation and so will rely only on weather forecast data.

Schedule Changes

  • None