Team Status Report for April 29

At this point, our project is essentially completed as we have our experiments finalized and integration has been tested. There is no major risk that could jeopardize the completion of our project.

No changes were made to the design or schedule for our project.

Validation and Verification

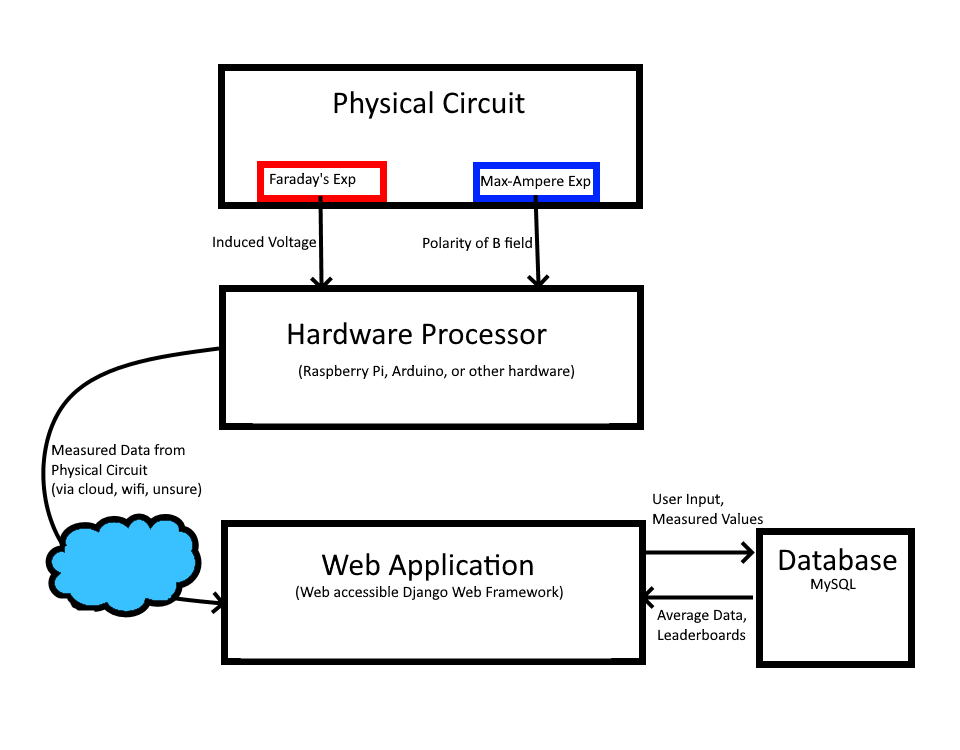
  1. We first tested the accuracy of our voltage readings. We did that by comparing the maximum peak to peak voltage recorded in Scopy to the voltages recorded on the web app via the ADALM. We were within our passing criteria of a maximum 3% error rate. This was expected as the ADALM oscilloscopes are very accurate themselves.
  2. To ensure low latency for the web app animation update when we make a change to the physical circuit, we timed the time between when the crank is first turned to when the web app updates its graph, and we were within our passing criteria of a maximum 1 second latency. We therefore, did not need to change our design after this test either.
  3. To test the repeatability and reusability, we wanted to ensure the circuits last for around a 1000 attempts (any physical change made to the circuit). We tested that with the help of a power drill running continuously for around 1.5 to 2 minutes as shown in the final presentation. That helped ensure our experiment could last for long periods of repeated usage. For the Ampere’s law experiment, we essentially used the ADALM signal generator to produce an AC signal for the solenoid that would continuously deflect the compass to ensure it lasted for many rounds of battery polarity changes. Both the experiments passed the tests, ensuring our design is robust.
  4. Rotated magnets in the Faraday’s law experiment by hand and used an oscilloscope to measure the induced emf. A Vpp of 4.54 V was achieved at 6.65 Hz, which is higher than the turn on voltage of an LED. The induced emf was able to turn on two red LEDs in series, and a red and a blue LED in parallel.
  5. Measured the current through the Ampere’s law experiment to be around 2 A. The induced magnetic field strength is approximated to be 5.7 mT with Ampere’s law, which was able to deflect the needle of the compass significantly (~180 degrees).

Team Status Report for April 22

Currently, the most significant risk that can jeopardize the success of the project is not having high quality educational content for the web application. Ultimately, our project aims to educate and inspire people about electromagnetism. However, people will not learn as much if the educational content is unclear, boring, or too easy/too difficult, even if the experiments work perfectly and the integration is seamless. Therefore, to mitigate this risk and make the content more instructive, all three of us will proofread and edit the modules for the three different difficulty levels. We will also try to have friends and family to read the modules and provide feedback. Additionally, we will solicit advice from people with expertise in electromagnetism on how to present the concepts intuitively if we have trouble explaining certain points clearly. We can also refer to old lecture slides, notes, and recordings to confirm our explanations.

No changes have been made to the design and implementation of our project, and our schedule remains the same.

Team Status Report for April 8

Having completed our interim demo, we believe we are on track to achieve our desired end-result for the final presentation. The most significant risk now would be being unable to complete building our booth for the demo. This however, should be a relatively straightforward process as Shizhen has figured out the laser cutting process that we will use to build our display cases. We will start work on this in the next 2 weeks to have the booth ready by demo day. Another risk is failing to display the oscilloscope plots in the web application seamlessly. Right now the user experience with the animated plots is not ideal as sometimes the plot can fail to display and the plot lacks interactivity. To mitigate the risk, we will attempt other methods to display the plots, such as using Scopy, if the problem cannot be solved.

No changes have been made to the design of our system and our schedule remains the same.

Team Status Report for April 1

Design Changes

Because of the superior instrumentation capabilities of ADALMs compared to Arduinos, we are now focusing on developing the hardware/software connection with an ADALM. The change does not incur any monetary cost, as we have access to ADALM already. However, to accommodate this change we need to learn to interface with ADALMs directly without using the Scopy graphic user interface so that the web application can access the data captured by an ADALM’s oscilloscope.

Risks and Risk Management

At this stage of the project, we have built the three separate systems (the web application and the two experiments) and need to integrate them. Therefore, the most significant risk is failing to come up with a hardware/software bridge. To manage this risk, we have explored two hardware options (ADALM and Arduino) to measure the experimental values in real-time and a few specific methods to interface with the hardware, so there is a high likelihood that one of these methods will work. If we fail to obtain data captured by the ADALM directly, we will use Arduinos as a contingency plan.

Schedule and Gantt Chart

We have made some updates to the schedule for the last few weeks of the project. The updated Gantt Chart is attached below.

Team Status Report for March 25

As we prepare for the interim demo next week, the plan is to have circuits for the two experiments finalized, and the shell of the web app completed (this would not include the content of the web app, which can be easily added in the week after once the ability to create modules and add images has been finalized for the interim demo).

The most significant risk to our project at this stage would be to not reach the interim demo deadline. We managed this risk by having the demo circuits (on breadboards) already made in case there are issues with soldered circuits. The web app is largely complete with functionality and ready for integration with the circuits.

No changes have been made to the schedule or the design of the system.

Team Status Report for March 18

Currently, our most significant risk would be the integration of the induced voltage measurements into our database. In the upcoming weeks, we will be working on getting the Arduino data into our web application under the specified latency limit. We have tested the Arduino sample gathering timing, which appears to be under 1 ms per sample. The remaining part of the latency would be to send the data to a SQLite database and have our web app gather that data from the database itself.

As of now, no changes have been made to our existing design of the system and the schedule remains intact. In the following 2 weeks, we will finalize our experiments by soldering them such that they are ready to be presented in the booth. By then, the web app framework will also be prepared such that we can start adding content to it in the following weeks.

Team Status Report for March 11

Having done the design report and having received the materials for our experiments, the most significant risk right now would be not getting our experiments to work as intended (unreadable/undetectable voltage values in the Faraday experiment, unnoticeable changes to compass in the Ampere-Maxwell Experiment). We intend to make mockups of the two experiments with the materials we have received and test the results of various inputs to ensure our experiments are viable and contribute to our learning objectives for the booth. For contingencies, we already have various fixes lined up for the kinds of issues we expect (using magnets instead of compass if Ampere-Maxwell output is not visible, using capacitors to lengthen duration of voltage spike in Faraday experiment, using amplifiers to increase voltage output in Faraday experiment for more measurable values, etc).

No changes have been made to the existing design of the systems other than the modifications to the Faraday’s law experiment, as were mentioned/shown in the design review report. The schedule remains unchanged as well from what was shown in the report.

As for new tools that we will need to learn, we have determined that we will use the Arduino to read voltage values and send it to a SQLite database, which will be queried by the web application to reflect the induced voltage scores on screen. As a team, we have some experience in using Arduino and SQLite, but we may need to explore more details to ensure we are reading, sending and querying values in the most efficient way possible. We probably also need to learn how to 3D print some custom parts using the 3D printers in TechSpark.

Team Status Report for February 25

Risks and Risk Management

This week we confirmed that the Arduino board can transmit voltage data to a local database through USB connection. However, we discovered that the measurements are not as accurate as we expected, especially for signals at higher frequencies. Additionally, Python may not be fast enough to read and write data of high frequency signals in real time. The inaccuracy and latency will cause the animations of the E and B fields to be inaccurate or delayed. To mitigate this risk, we will look for ways to improve the accuracy and latency. If this approach fails, we will resort to using other hardware.

Changes to the existing plan and team work assignments

Because the Faraday’s law experiment that relies on linear motion does not generate enough electromotive force, Shizhen will work on modifying the design, possibly incorporating circular motion instead in the next few days. Aaron struggled with some web implementation this week, but is overall still on track and will work to cover this implementation next week along with the current schedule for next week.

Otherwise there are no changes to our schedule as we are generally on track.  We are also not making any changes to the Ampere’s law experiment as the mockup has confirmed its feasibility. We will proceed in the next week by ordering our circuit components and building the actual experiments afterwards, while testing the Arduino chip with our experiment mockups. As we wait for the circuit components to arrive, we will also work on improving the accuracy of the voltage sensing method, a new task that arose from the recently discovered design challenge.

Progress

As tested by Shizhen, the Arduino chip is able to send serial voltage data via a USB cable into a CSV file with Python. The database that Aaron is implementing for the web app functions on python as well, so integration seems easier. This averts the major risk that we mentioned in our previous report. We will now focus on delivering the CSV data to the web application.


Team Status Report for February 18

This week, we modified the block diagram slightly, since we identified that both experiments will be gathering voltmeter data that will be sent to our hardware bridge, which will then be accessed by the web app via a MySQL server. Furthermore, we developed schematics of the Faraday’s Experiment and the Ampere-Maxwell Experiment. The wireframe for the web application was also developed, along with some pages of the web application itself, and a 3D model of the booth was made. Our schedules remain unchanged but the Gantt chart was updated to reflect the assignment of each task to a certain individual for more clarity.

Risks and Risk Management

We are still working on confirming the hardware bridge. We have ordered a Wifi-enabled Arduino and plan to use that to take in voltmeter readings and direct that to the MySQL server. We intend to test this once the Arduino is delivered. If the Arduino is unable to send the voltage data to a MySQL server, we will consider alternatives such as using a TCP/IP Voltmeter device which is slightly more costly ($60) but guarantees voltmeter readings being fed into a MySQL database.

Changes to the Existing Design

After discussing with Professor Sullivan about transmitting data read by sensors (e.g. voltmeters) to the database for the web app, we decided for now we can just send the data to a local machine through wired connection, instead of sending the data to the cloud, such as AWS, to simplify the design and focus more on the core of the project. The schedule, however, wouldn’t actually change because we will spent the time allocated for implementing the wireless connection on developing wired connection.

Principles of Engineering, Science, and Math

Idea generation and selection: We came up with a few viable experiments to demonstrate Faraday’s and Ampere’s laws, and we decided on the ones that most align with our goal of making the system instructive yet simplistic, after considering the pros and cons of each option.


Team Status Report for February 11

Beyond engineering: The broader considerations of The Well of Maxwell

Our project includes considerations for education, safety, and socioeconomic inequalities. Since our goal is to teach students electromagnetism and inspire them to explore the field further, we want the educational modules to be accurate, authoritative, and effective. Moreover, we want learning to occur in a safe environment, so our system must be robust and not harm the user. Lastly, we want to provide a way for students who don’t have the resources to experiment with E&M to learn by doing.

Risks and Risk Management

One of the most significant risks would be our ability to convert the hardware stimuli (voltage source polarity, direction of induced current and magnitude of induced voltage) to digital data that will be taken in by our Web Application. This is the major connection between the hardware and software aspects of our project. This is the main blocker for our project progress, since the components we use to build the experiments will change depending on how we digitize the hardware data. As a contingency, we could use a digital multimeter with a built-in Web Interface or we could attempt using ADALM and Scopy, though these methods would be more ‘clunky’.

Changes

The design of the system has not been changed since last week.

Progress

We made a rough block diagram with regards to the design of our system and we intend to use it to guide us throughout our project.

We also made a wireframe specifically for the web application and built the skeleton for the web application, and partially implemented OAuth admin logins, welcome page, and basic home page. 

According to our current schedule, we should be finalizing the hardware to digital data conversion mechanism within the next two weeks, while starting on a rough design of our two experiments such that we can finalize the values of the circuit components we need. Additionally, the rough build for the web app without any integrated components should be finished within the next two to three weeks. That will allow us to purchase components within 2-3 weeks for the experiment setup.