Ian F’s Status Report for 4/29

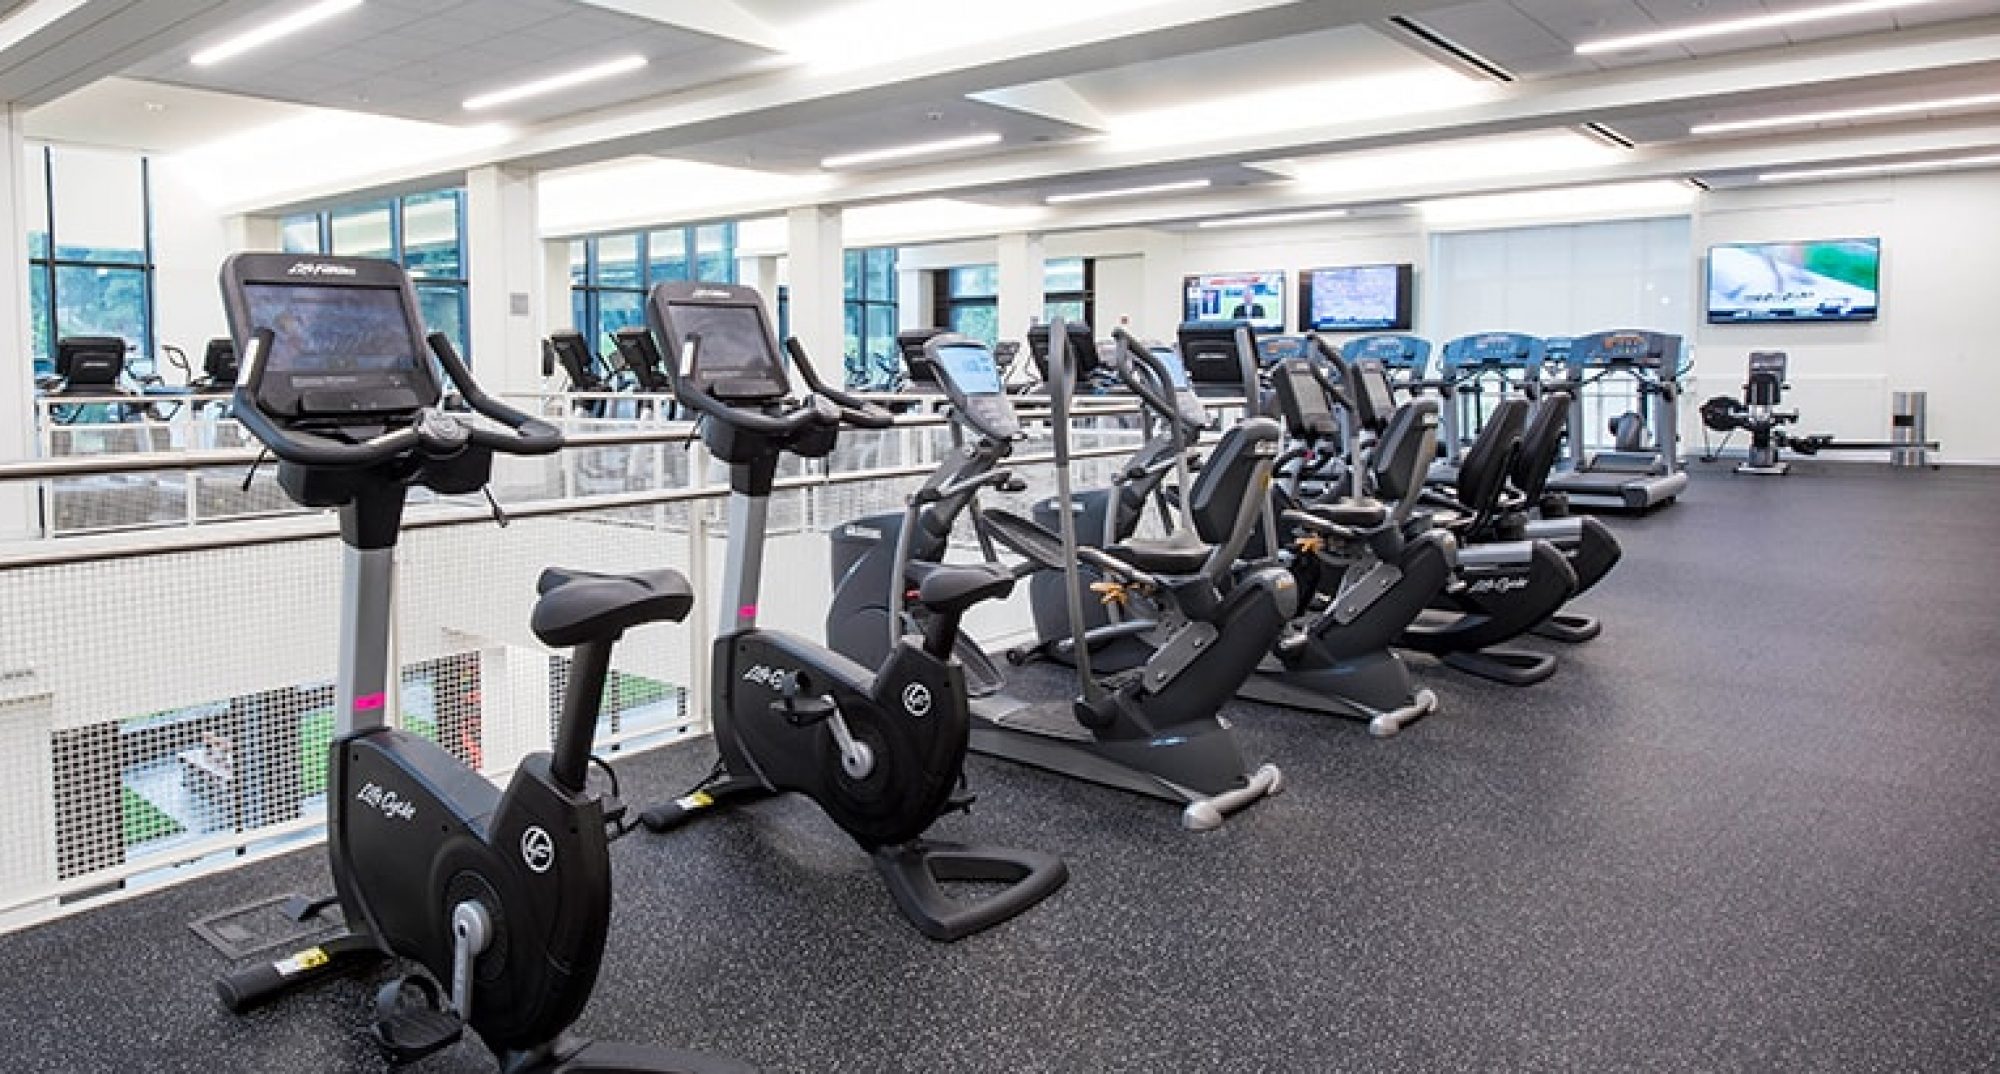
This week I mainly focused on encasing and mounting options for our sensor module, specifically for our bike module. Prior to our final presentation, we were using a really crude method to prop up our module in order to avoid detecting the handle bar instead of the actual user.


So in order to improve our sensor positioning I developed a version of the case presented in last week’s report, adapted to the position in the pictures above. I utilized the center tray as the base for it and developed the following cases:

These cases were designed to be placed on top of the center tray from the bike and thus hinders our invasiveness goal sine it renders the tray useless for the user. However, this spot and method is the simplest way of mounting without redesigning the whole module or tampering with the dashboard. The case on the right is the first iteration which did not print smoothly on the corners on top evidenced by the curvature. In addition, this case is smaller and has a lower angle of elevation than the one on the right.

Nonetheless, after printing, I installed our module in both cases at the gym and adjusted the ADC reading based on threshold testing. This testing consisted of me standing upright at the very edge of the bike to see if I was detected or not, then riding the bike and tilting my body backwards in a way that would realistically mimic a user leaning back on the bike and observe how the module behaved. Clearly, we want the module to not detect a person standing behind the bike, but we want to be able to accurately detect a user on the bike even if he/she is leaning farther back than usual.

So after much trial and error I was able to determine a range of ADC values and test small variations in this value to ensure proper functioning of the system. I found that we had a lean-back vs out of range detection compromise. If we wanted to detect somebody leaning back we ran the risk of setting the threshold too low and detect a person standing at the very edge of the bike, while if we set the threshold too high we ran the risk of not detecting a user leaning back while guaranteeing a person standing at the edge was not. In light of this, I observed bike users in the gym and saw that most users leaned forward or stayed upright rather than lean back, So I decided to compromise a bit for the lean-back and focus on not detecting anybody at the edge.

With this in mind and as per the data tables and graphs we produced earlier on, I fixed the ADC reading threshold at a lower value from what was originally set for the treadmill in order to reduced the detection distance. In addition, I noticed that the larger case needed a lower threshold than the smaller one given the angle variations they had. Thus I also tested different heights of users in order to determine if the angle on the larger case was too high to accurately detect shorter users. Both cases, with different tuning, handled different heights satisfactorily (heights that are reasonable for users of the bike and heights that the manufacturer suggests, 4’9” to 6’5′).

With that out of the way I proceeded to perform the same tests and gym trials highlighted on the final presentation (document which highlights our unit testing – gym trials – and overall testing of the system – detection delay and accuracy). Our detection accuracy improved as expected, with pretty much only 1 trial failing under normal circumstances. Under extreme inclination (leaning back) the reading and detection was not stable and worked a little over half of the time, but this was to be expected as mentioned above. So we are betting that usage will not resemble this scenario and our detection threshold is appropriate.

Given that both cases performed similarly and better than the crude setup we had before the final presentation, it is now a matter of preference when it comes to choosing which model of the case to use. At the moment I am leaning towards using the larger angle one given that the smaller angle case is technically damaged. Thus if we choose to print the smaller one we would need 2 fresh prints whereas only 1 is needed for the larger angle one. This decision will save us time and costs. Nonetheless I believe our budget is still large enough to accommodate 2 fresh prints. so we will see.

So for next week we will perform more testing to see if either case has an edge, then fabricate them as part of our final system, and finally report our findings for the last set of deliverables we have for the upcoming week.
Ian F’s Status Report for 4/22

For these past two weeks I have been working mostly on the physical components of the senor module. Parting from the last status report, I was able to develop a mobile and compact version of our sensor module. Following the wiring diagram from my last report, I proceeded to solder and glue everything together forming the following module pictured below:

Afterwards, in collaboration with Nat, I uploaded the modified script for the NodeMcu with the web-app integration and successfully produced 4 fully functioning modules with web-app occupancy capabilities:

Next, I shifted my focus on creating a 3D printed enacisng prototype for the modules using Solidworks and the Ender printers at the Techspark facilities. I created one unsuccessful one and proceeded to refine it to create a second more acceptable prototype pictured below:

While I waited for the fabrication of the prototype case to be completed I tested out the modules in the UC Gym and ran a couple trials to determine what parameters needed to be adjusted. The treadmill trials were a success since I was capable of detecting proper occupancy readings with 10 one-minute stand-in trials, 10 separate pass by’s behind the treadmills mimicking people walking by, 10 separate stand-ins outside the detection range in terms length, and 10 other stand-ins to the side of the machine. All of them worked successfully in terms of the hardware, meaning that the built-in LED of the NodeMcu (our physical indicator) lit up successfully every time.

When it came to the bikes, things did not run as smoothly. First off I had a lot of trouble finding a good mounting position. I was able to improvise a rather crude setup and proceeded to run the same tests I did for the treadmill. The main set that failed was the passer-by trials since the detection range was configured to the treadmills and therefore too long, meaning that the ADC reading boundary needs to be adjusted to fit the length of the bikes. All other trials were successful.

Nonetheless, there are some some significant concerns related to the mounting position of our modules on the gym equipment. The testing took place with a sensor module in a non-fixed position. This is a concern in the case of the treadmill because if some user were to incline the treadmill to the max or use the max speeds of the treadmill causing lots of vibration, the sensor module might slip and fall. In addition, the location in which it was placed is directly in front of a hole were gym user’s belongings can be placed, objects that if placed there would effectively obstruct the sensor module. As a result other mounting positions were considered but have proved to be challenging due to the flush design of the dashboard. On top of this, the bikes dashboards have awkward angles that made the testing of our modules quite difficult.

During this testing I realized that my encasing is not ideal and that perhaps a possible implementation with the sensor connected through wires but separated from the battery pack and the NodeMcu might be ideal. The ideal solution would require tampering with the machine dashboards and potentially drilling holes to add and safely secure the mounts for the modules. Nonetheless this is obviously not allowed. Thus, this might prove to be a setback and a potential impediment in our implementation plan.

Following the gym trials, I tested the module for power consumption more formally than last time since now the Wi-Fi capabilities of the NodeMcu were active. I measured that the sensor draws roughly 21mA. Nonetheless the NodeMcu readings were a bit inconclusive. During setup, the NodeMcu draws roughly 80mA but then drops down to roughly 26mA. However it jumps frequently to 80mA and back to the 20s range. This does not affect our 16.5 hour requirement but it does make calculating the precise consumption a bit hard. Thus, I believe we will use worst case consumption estimates to provide the overall battery life

In addition, other occupancy testing was done in a more controlled environment to see the full integration. These worked successfully for the most part with certain hiccups pertaining the back-end software implementation.

So, further analysis and refinements need to be made in terms of powere consumption and the software/sensor back-end before the final report and demo. Thus for next week I plan on preforming more testing on the modules for power and integration as well as and solving the issue of mounting the module on the gym equipment as best I can. The mounting issue threw me a bit off schedule, yet when it comes to the system as a whole, I would say that portion went according to plan.

Ian F’s Status Report for 4/8

This week significant progress was made on the sensor module compared to other weeks. First off, I decided to formalize the testing I described in previous reports integrating the NodeMcu with the IR sensor. For this testing, I set up my circuitry as depicted below:

The IR Sensor was powered by a lab power supply set at 4.8V and the NodeMcu was powered directly from my computer via MicroUSB. As you can see I decided to attach a voltmeter in between the output voltage of the sensor coming into the analog A0 port of the NodeMcu and ground in order to measure the voltage going into the NodeMcu. Following my research into the Arduino IDE and the NodeMcu capabilities, I discovered that the analog voltage coming in can be read by the native analogRead() function that has a 10-bit resolution measurement capability courtesy of its analog to digital converter. Rather than outputting the voltage measured directly like a voltmeter would, the function outputs an integer reading that is mapped and correlated to the voltage and  ranges from 0-1023. With this in mind I developed the following simple script in order to determine the correlation between the voltage measured by the voltmeter and the digital reading outputted by the analogRead() function:

With the script set and uploaded to the NodeMcu, I placed the sensor near the edge of the table and used a measuring tape (in inches) in order to observe how the voltage and the digital reading changed based on the distance I stood from the sensor.

With this setup in place I utilized the serial monitor and the serial plotter from the Arduino IDE in order to sample and record the digital output of the sricpt, and note by hand the voltage I saw on the voltmeter in front of me. I compiled the data and produced the following table and graphs:

I recorded Low and High voltages and ADC readings respectively since the measurement was not exactly smooth. Therefore, I noted the highest and lowest voltages measured by the meter and the peaks and valleys in the serial plotter corresponding to the ADC reading. In addition to relating the distance with the output voltage and the ADC readings, I related the ADC readings with the voltage and produced the following plots from our data table: 

As expected, the measurements were more accurate than the ones obtained in the informal purely analog testing described a few weeks back using the LED setup. The shape of the curves also met our expectations and resembles the one provided by the sensor manufacturer. Having said that, our plots are not exact reflections of the manufacturer graph, but close enough for the purposes of our implementation. I do recognize that there are some errors that come from the experimental setup and human measurements. Thus, the plot discrepancy could be attributed to our testing methodology. Nonetheless, the testing was conducted methodically and as carefully as possible. Thus I was confident that this data would serve as the basis for our algorithm development.

With this data in mind , I was able to create an Arduino Script for the NodeMcu that used the ADC readings to calculate the distance from the IR sensor in inches. This script was developed with the intention of using the calculated distance as the metric that would determine whether or not occupancy data would be sent by the NodeMcu. However, after some testing, I realized my algorithm and my script were not as precise near boundary distances of detection like 3.5ft as established by our design requirements. In other words, this was not sufficient to meet our detection accuracy since it was imprecise in situations where we needed it to be precise.

As a result, I looked at the data once again and utilized the relatively linear relationship between ADC and voltage in order to produce a simpler yet more accurate script. I also modified the circuitry and added an LED connected in between the D4 port and GND that would reflect the behavior of the sensor. The red LED would turn on when the distance was above 3.5ft and off when the distance was less than that.  The blue LED embedded in the NodeMcu would do the opposite.

This algorithm produced better results near the 3.5ft boundary. I also tried to test different detection angles and the sensor did not detect at big angles from the center line if none at all. The sensor pretty much worked in a straight line, which is good news for us.

With this phase of testing complete, I shifted my focus to making the sensor module mobile by incorporating the batteries from our design report. At first, I hooked everything up to the power supply but then proceed to use batteries instead. Regardless, the circuit configuration was the following:

I was able to get everything working both with the DC power supply and the battery pack, effectively creating a fully functioning and mobile sensor module, albeit without Wi-Fi capabilities just yet.

In addition, I measured the output voltage produced by the pack which turned out to be 5.4V (fully charged pack) (higher than the expected 4.8V). In addition, each cell is rated with 2,800mAh which brings the grand total to 11,200mAh. With this in mind, I decided to measure the current drawn by the sensor and NodeMcu individually, while detecting something in the desired range and while not. The NodeMcu registered a peak of 59mA while detecting and a low of 25mA while not detecting. On the other hand, the IR sensor readings from the multimeter unstably fluctuated to the point that no set measurement could be made. Nonetheless it did not surpass the 30mA mark that we had expected based on our research for the design report. Further power consumption studies need to be made with a fully Wi-Fi transmitting module, yet, based on our worse predictions of peak consumption, we estimate that we will meet the battery life requirement of 16.5 hours and perhaps surpass it. I was also employing a battery pack with a switch that could greatly extend our battery life. However, further testing will determine which pack is necessary and will be chosen for the module (static or switch enabled pack).

Aside from this, I started preliminary work on the fabrication of the senor encasing using Solidworks. Yet a possible implementation using AutoCAD, laser cutters, and acrylic plastic could be a solution as well.

In consequence, for next week my plan is to integrate the sensor and NodeMcu to transmit occupancy data with my teammates and then proceed to study the power consumption. Afterwards, I will shift my focus to the encasing and the mounting mechanism. I must acknowledge it is a tight schedule due to my limited knowledge of AutoCAD and Solidworks, yet I and the team in general is on pace according to the revised Gantt chart and schedule posted on 4/3.

Ian F’s Status Report for 4/1

This week I missed a couple of sessions due to illness and therefore some progress was made but not significant enough to fulfill the schedule I had planned for this past week.

Regardless, I decided to perform some tests directly interfacing the NodeMcu with the IR sensor utilizing the simple Arduino script mentioned in last week’s report to perform simple analog reads and observe the voltage displayed in the serial monitor of the Arduino IDE. After interfacing them together, I noticed my measurements were quite inaccurate and inconclusive. After a while, I realized that the problem was the sensor since it was not properly communicating with the NodeMcu. I discovered this after I turned off the power source to the sensor and the readings were still confusing and exactly the same as when the sensor was powered on. I tinkered with the Arduino script and revised my connections yet the results remained the same.

In light of this, I replicated the analog setup detailed in the status report for 3/18 to see if analog measurements were recorded as expected and observed during those past trials. However, no readings were obtained and no voltage drop was observed across the LED (it also did not turn on). As a result, I need to review my wiring to see if that’s the problem or try out a different sensor since the one I was using might be non-functional (which is what I’m inclined to believe).

Thus, the plan for the weekend and the beginning of the week is to get a fresh analog setup with new components up and running and then set the connections with the NodeMcu in order to properly test the Arduino script. The goal is to have this subsystem running by the interim demo and and then merge my sensor script with the other communication script that handles the data transmission portion of the overall system.

Ian F’s Status Report for 3/25

Last week’s scheduled testing did not take place. In consequence, I believe I am behind schedule but this is not something that will have significant or negative repercussions down the line. I believe that next week I can catch up and develop this subsystem further in order to meet the requirements and the expectations for the interim demo on the first week of April.

Having said this, some progress was made on the code side of things with the NodeMcu and the sensor. I worked on two versions of an Arduino script for the NodeMcu which takes in the voltage outputted from our sensor and performs the necessary calculations based on the graph on the sensors datasheet. I have not tested the script with the sensor directly. As a result, the plan for next week is to complete the testing mentioned last week and download the script onto the NodeMcu and see if it requires modifications or any other refinements. My hope is that with this script we are able to obtain digital distance measurements that can be compared with the analog ones obtained from our lab equipment. This way we can see if our script needs work or if it provides better results than the analog testing.

Ian F’s Status Report For 3/18

This week was somewhat slow in terms of progress and unforeseen events caused some setbacks for me. As a result I am still behind schedule, although not as critically as past weeks. When it comes to deliverables for the week, some personal circumstances caused a delay in my ethics assignment, resulting in a 1 day late submission of my write-up. In addition, I was expecting the sensors to be available by this week. However, after consulting at the equipment desk, the staff informed me that the shipping was delayed and no updated delivery date was provided by the distributor. 

Despite this, I was able to get my hands on a few sensors by the end of the week and begin some informal testing to understand and observe their behavior. My aim with this lab session was to familiarize myself with the equipment and take some initial measurements that will guide more formal experiments next week. Thus, the main goal was to connect everything properly with analog components and merely determine if the sensors were operational.

Having said that, before connecting any components, I reread the documentation for our sensor. On it, the manufacturer suggests including a by-pass capacitor of 10μF or more between the input voltage (Vcc) and ground (GND) in order to stabilize the power supply line. As a result, I sketched the following circuit diagram and connected the components accordingly.

The DC voltage source was configured initially to 5V and an LED was connected in-between ground and Vo in order to measure the voltage outputted with the voltmeter shown and have visual cues of the sensors behavior. After firing up the circuit, I observed the LED dim as the distance from the sensor was altered. However, on the meter I saw some figures that were concerning. I compared the voltage drop across the LED to the following graph and numbers provided by the manufacturer.

Admittedly I used a rather crude form of measurement using stacked rulers, yet I observed that the sensor did not behave as depicted on the graph. Firstly I saw that the voltage drop across the LED was never higher than 2V. Secondly the output was off by a few centimeters. For instance, I had expected to observe upwards of 2.5V around 16cm yet the peak voltage was observed closer than that at around 11cm and it was still no larger than 2V. I also noticed that the sensors behavior at very close distances is not as expected. since the LED was still on and the voltage was high despite the object being less than 5cm from the sensor. At large distances the sensor started to behave as expected fluctuating between 0.5 to 0.7V. However, it was quite jittery. I also proceeded to toggle the input voltage based the operating range of the sensor (4.5V – 5.5V), yet this did not seem to have any effect on the output which is a behavior that is beneficial in our case. ( I performed most tests at 4.8V since this is the voltage we expect from our battery supply later in the future when we make the sensor module mobile.)

As mentioned all these results were informally recorded. The unexpected behavior is most likely caused by the properties of the LED and my thoughts are that these measurements will be more true to what the manufacturer suggests when the NodeMcu is integrated and connected to our sensor. So for next week, I will test things more meticulously and properly record the data from these experiments. I will try some things out at the analog level to see if the behavior described above changes. For instance, I intend to use a circuit configuration that is not dependent on the LED. I will also employ a measuring tape to obtain more accurate distance readings. In addition, I want to see if changing the power supply line capacitance has any effects on the output voltage (which I think not) and perhaps figure out if there is a ways to reduce the jittery behavior at long distances so that we can feed a better voltage to our NodeMcu.

Speaking of NodeMcu, I set up the Arduino IDE and performed some basic tests to familiarize myself with the component and its behavior. I followed an online tutorial to setup the IDE with the NodeMCU and successfully ran a simple program suggested in said tutorial that blinked an LED every second.

Thus for next week, after finishing my tests with the sensor, I will proceed to develop a script for the NodeMcu that will display the distance measured by the sensor connected to it. I will compare and contrast these results with the analog measurements as well as the graph from the datasheet and see how we can fine tune the measuring portion of our project or if an entirely different sensor or approach is necessary (which we estimate is highly unlikely).

Ian F’s Status Report for 3/11

For the week before the break, no progress was made on my work with the sensors and the design report turned out quite poorly and unsatisfactory. As a result, I am behind the projected schedule. Therefore, next week will be critical and significant work must be done in order to catch up and deliver on our product.

The first order of business, will be to pick up our sensors from the ECE equipment desk and start the local testing right away so we can have metrics and data to feed to our NodeMcu as well as understand the behavior of the sensor in order to fine tune it with our microcontroller. Once we have the sensor up and running, we will have a few main variables that will guide our experimentation. These are: distance from the sensor, fabrics/textiles and colors used for detection as well as the angle from the sensor (both vertically and horizontally) at which we place our subject.

In addition, the data gathered from these trials will also inform our power consumption estimates and based on this we will modify the plans we outlined on the design report or simply go ahead approve the batteries we intended to use as appropriate and proceed to order them.

However, prior to starting the testing at the beginning of the week, I must carefully review the design specs of the sensors and draw sketches of simple electrical circuits depicting the configuration that will be used for testing as well as the one that involves our NodeMcu. Careful consideration must be taken when connecting these components since we do not want to damage or ruin the equipment we have. After the trials are completed, I will work closely with Nat to integrate the sensor and the NodeMcu in order to have a working module that can then be scaled to the quantity we are aiming for.

Once we have the sensor and NodeMcu running, as part of my contribution for this subsystem, my focus will shift to the mounting mechanism that will be used to place our sensor module on the selected gym equipment. As a result,  I will have to brush up on my knowledge of fabrication techniques and simple prototyping. For the encasing that will house our module I must analyze which method of fabrication like 3D printing, manual woodwork, among others, is best . If we decide to go the 3D printing route, this will require familiarity with CAD tools and other similar suites available in the Makerspace, as well as careful scheduling and planning to reduce the time wasted while we fabricate encasing prototypes. If we deem this to be inefficient or too complicated for the purposes of our project, then I will explore simpler and perhaps even cruder methods of fabrication.  However, we must keep in mind our requirements of stability and robustness to vibration of our module when making this decision. Thus, we will most likely choose a fabrication method and tools that provide a balance between sophistication and ease of implementation and use. We want our module to be strong and rigid but we also want a tool that is simple to use given that we need to make the most out of the time we have and we need to catch up and keep up with the schedule.


Ian F’s Status Report for 2/25

After this week’s design review presentation we received some feedback pertaining the initial design of our system. With the questions we were asked in mind, my tasks for this week consisted in further researching the components for our Sensor Module. One question that came up was the detection angle of our sensors. In all honesty, I was more focused on the range (distance of detection) of these sensors and I admit I did not factor into my calculations how the detection angle of our sensor affected our system. Therefore, I looked into the documentation of our sensor and investigated other alternative sensors just in case. After some  hesitation I believe that our current chosen sensor works well based on our implementation.

Having said this, professor Mukherjee brought up a possible different implementation of our solution. He discussed a multiple sensor approach to obtain more accurate occupancy measurements that were impervious to the external environment around the gym equipment (people, movement, etc.). Nonetheless, after some consideration I believe it is best to stick with our one sensor approach given the simplicity of the communication between the sensor and the NodeMcu. Our sensor is analog and the NodeMcu ESP8266 only has a single analog input which would make the incorporation of multiple of our selected IR sensors practically impossible. We would have to research other sensors primarily digital ones that can be incorporated seamlessly with the NodeMcu and come up with an algorithm to coordinate the multiple sensors to reach a decision on occupancy. This task does not seem so difficult. Yet other considerations were also discussed.

A point that came up is how invasive our system would be if we were to incorporate say three sensors on a treadmill. This is certainly feasible but perhaps the wiring of these sensors might result cumbersome for users. In addition we would have to factor in power consumption which would most likely not meet or battery life requirement. As a result, and in tandem with our size requirements, we believe that it is best to stick with only one sensor for now and experiment with calibrating and tuning our microcontroller with our sensor.

Due to this deliberation in implementation and sensor type, no orders were placed this week, which I anticipate will put me behind schedule. Nonetheless, this setback does not hurt the overall pace of the team given how we decided to divide the tasks and how compartmentalized our testing plan and schedule is. Our verification plan has a lot of small testing phases which will either way take up most of the time after the parts arrive, hence setbacks can be easily recovered from. In my case I will have to get started as soon as I can with a bit of an accelerated pace on the IR testing in order to meet the goals of integration we have.

As a result my plan for next week is to complete the order of parts and hopefully receive them as soon as possible to start experimenting and testing locally according to our testing plan. In the meantime, I will most likely take more concrete physical measurements of the gym equipment in order to analyze these as well as compare them with our equipment’s manuals and documentation. These metrics will get the ball rolling for the work that needs to be done with respect to the Sensor Module mounting mechanism and will aid in setting up our testing environment which will emulate the machines we will be working with. As a result, next week I will be checking out the Makerspace to investigate the resources available to fabricate our setup (wood, tubes, tools, etc.). I will also research CAD and other suites since we have decided to fabricate our encasing for the sensor module locally. From this investigation, I will decide how to proceed with the mount design. All of this will aid in developing our Design Report which is the deliverable for next week.

Ian F’s Status Report for 2/18

My task for this week consisted in developing ideas pertaining to the physical aspects of our system. So, this week I spent the majority of my time researching components and parts we would need to complete our project as well as ways to link them all together. We have decided to use IR sensors and I have proposed the use of either the Sharp GP2Y0A02YK or the Sharp GP2Y0A21YK0F. Both these sensors work much in the same way however their distance detection ranges differ with the former having more range than the latter. Theses sensors were considered in the first place given that they are quite easy to work with and simple to interface with other pieces of hardware we are considering.

From this research, we have decided that the hardware module attached to the gym equipment will consist of our IR sensor connected to a Nodemcu and a power supply to power both of these. We have opted for Nodemcu due to the fact that it is a low-cost and open-source IoT platform that’s based on other components we thought of initially like the ESP8266 chip. This module will be interfaced with a Raspberry Pi which will handle the IoT component of our design.

In addition, I surveyed the University Center’s gym to get a feel of the machines and equipment we will be basing our design on. We will be using treadmills, stationary bikes and stair climbers as our base. I noted the models and styles of the machines and based on these observations I believe it would be best to attach our physical module to a mount that works like a phone bike mount does. Many of these machines have a lot of tubes to which we could secure or module. Therefore an adjustable design with rigidity in mind is optimal to ensure our sensor is always properly positioned. Below is a picture of a possible template for our design of the physical encasement of our hardware module.

For next week I am aiming to polish the details of these physical modules before placing any orders. I need to consider the power consumption and other physical aspects of our module like weight among others to strengthen our design. Based on this research, I will consult with my teammates and decide which process would be best to fabricate our modules (3D printing, carving, or off the shelf solutions, etc.) In addition I want to have the communication protocols of our modules clearly planned out before moving forward with our orders.

Considering that our design is quite new compared to other groups, perhaps we might be a bit behind in terms of schedule. Nonetheless, based on what our team has discussed, this week’s progress seems satisfactory and we will work to keep the pace for next week. We understand that our process since the beginning of the course has been rocky and constantly shifting so much emphasis must be placed in terms of progress for the upcoming weeks.

Ian F’s Status Report for 2/11

Given that our team has decided to pivot and change our project entirely, the extent of my progress for this week encompasses researching technologies and concepts pertaining to our new idea. This new idea centers around gym occupancy, more specifically gym machines. We will most likely base the occupancy on motion and proximity; hence I have been looking into different types of sensors that we could use to accomplish the task of detecting a user/occupant. I’ve looked into ultrasound, IR, and LIDAR sensors as possible options for our implementation. At the moment, based on my findings I would suggest we use ultrasound, IR or a combination of both of these given that the task at hand for these sensors does not seem to require expensive components nor sophisticated measuring capabilities. Further investigation needs to be done to determine how these sensors will communicate and what the limitations and specs of these are. Based on that we can go ahead and order specific brands that are best suited for our task based in the information gathered. I’ve also looked into the communication between Wi-Fi cards and Raspberry Pi, yet I need to figure out the specifics of how the sensor will interact with the aforementioned components.