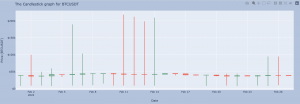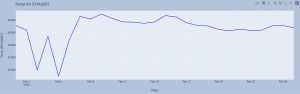
This week I kept working on the features for the website, specifically getting past data and plotting the trends for all the cryptocurrencies. I got the past data from the binance API and stored them using the pandas data frame. At first I tried to use matplotlib functions to plot the data and display it on the website, but I encountered many errors. In the end, I was able to plot the data using plotly functions instead. Right now the web app has candle charts and line charts displayed for bitcoin and ethereum, below are examples for each chart. Overall I’m on schedule for developing the web app, but since the RPI has not been delivered yet, I couldn’t work on tasks or testing related to the RPI for the past week. For now I will keep working on the web app and other parts of the project until the RPI comes, then I will switch to RPI related tasks. For next week, I will be working on the design review report and adding more features on the web app.