This week, the team decided to pivot to the web-bluetooth approach using a Flask server. Using this method, we were able to easily connect to the GearVR controller, enable notifications, and write commands to characteristics. With this, I started working on a javascript tool for us to visualize GearVR sensor values received in the notification buffer.
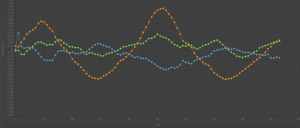
I found a javascript chart-creation package named Chart.js which could make different types of plots based on JSON data. Since our project should only register motion and play notes when the trigger is held on the VR controller, I decided to case on the trigger-on notification during the stream of real-time notification buffers. I tried parsing and plotting for the acceleration values first. Once the trigger was pressed, my code would start logging the sensor values, and would plot the x, y, and z values on a line chart once the trigger was released.
In this case, the y-axis is in m/s^2 and the x-axis is in “ticks”, which is approximately .015 seconds (as the average notifications per second was 68.6 notifications). Orange is x, blue is y, and green is z.