Isha Status Report 3/23

I converted the Matlab code for color detection with thresholds to Python using numpy and matplotlib.

I also wrote code to use Python to access the camera. I first tried using pygame to do this using the code from this link. However, a past image kept showing up when taking a new image since when the camera starts, a significant number of frames from the previous session are saved. Then I installed opencv and found this code to capture an image when hitting the space bar. This can be easily adapted to take in input from the piezo sensor circuit when a tap is detected.

We took a new set of 26 test images with our new poster board set up.

I finished the SVM code using scikit-learn to detect a red dot. I wrote a csv file, coordinates.csv, containing data from our test images to use to train the algorithm. I wrote the following files:

test_svm.py:
Loads data from file coordinates.csv. Uses the data to train the SVM algorithm. Uses the trained algorithm to predict if each pixel is red or not. Then finds the centroid of the red pixels and displays the image with the centroid plotted.

write_data.py:
Loads an image and searches for the red coordinates with hard thresholds. Uses a 2 pixel radius around the coordinate to find the values of red pixels. Saves the pixel A and B space values along with a 0 if it is a red pixel and 1 if it is not a red pixel to a csv file coordinates.csv

coordinates.csv
Contains data for the SVM alogrithm in the following format:
(A space value) (B space value) (0 for red/1 for non red)

color_detection.py
Loads data from coordinates.csv to train the algorithm. Takes a frame from the Logitech webcam when the spacebar is clicked. Analyses the image to find the centroid of the red pixels in the frame using SVM to predict if a pixel is red or not.

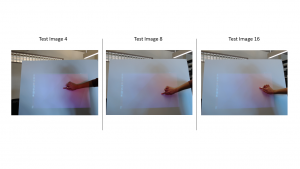
I looked at the results for all the 26 test images we have. The SVM code gets incorrect results for tests 4, 8 and 15 as shown below:

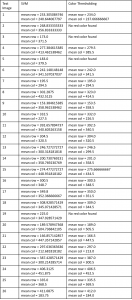
Basic color thresholding does not find red pixels for tests 2, 3, 5 and 19. I have saved these image results to the bitbucket repo so we can compare them.
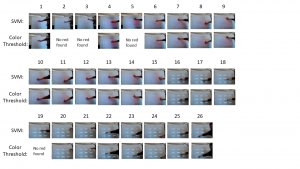

The detected coordinate of the red dot is slightly different for the two measures. A chart of the coordinates is included at the end of this post. I think the svm is not detecting the proper coordinate for all cases because right now it is only being trained on images 12-26 and not the images 1-11. I had only saved data from these images since the preliminary gui is projected on the poster in these images. Once I add all the data to the dataset I think that the algorithm will become robust enough to cover all our current test cases. I will also start to constrain our dataset to only contain every 10th pixel that is not red since the data file has become very large as each image has 480×640 pixels.

My progress is on schedule.

Next week’s deliverables:
Constrain the write_data.py script to write values for every 10th script instead of all the pixels
Detect green pixels in the image for border detection to be used in Tanu’s gui  coordinate calculations.
Isha Status Report 3/9

I have worked on porting the color detection code from Matlab to Python. We decided to move away from using Matlab in conjunction with Python to remove any possible delays in sending data between the two running processes.

Matlab has several functions that make dealing with image matrices easy and computationally fast. I am looking in to finding similar functions that I can use with Python so that searching for elements in an image matrix is not O(n^2) complexity.  I have been working with numpy to try and achieve this.  However, numpy matrices are maximum two dimensional. This is necessary so that we can get a reasonable real time response within our ideal metric of within 1 second.  Additionally, I am installing and familiarizing myself with Python toolkits such as scikit-image, matplotlib, numpy and scipy since there are no inbuilt functions for color space conversion in Python. If these tools prove to be unsuitable for our purposes, I will consider using OpenCV for color spaces.

My progress is on schedule. I aim to complete implementing the color detection and move on to SVM in the next couple weeks.

Isha Status Report 3/2

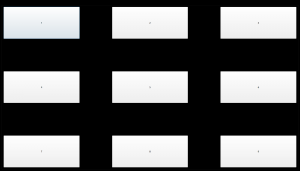
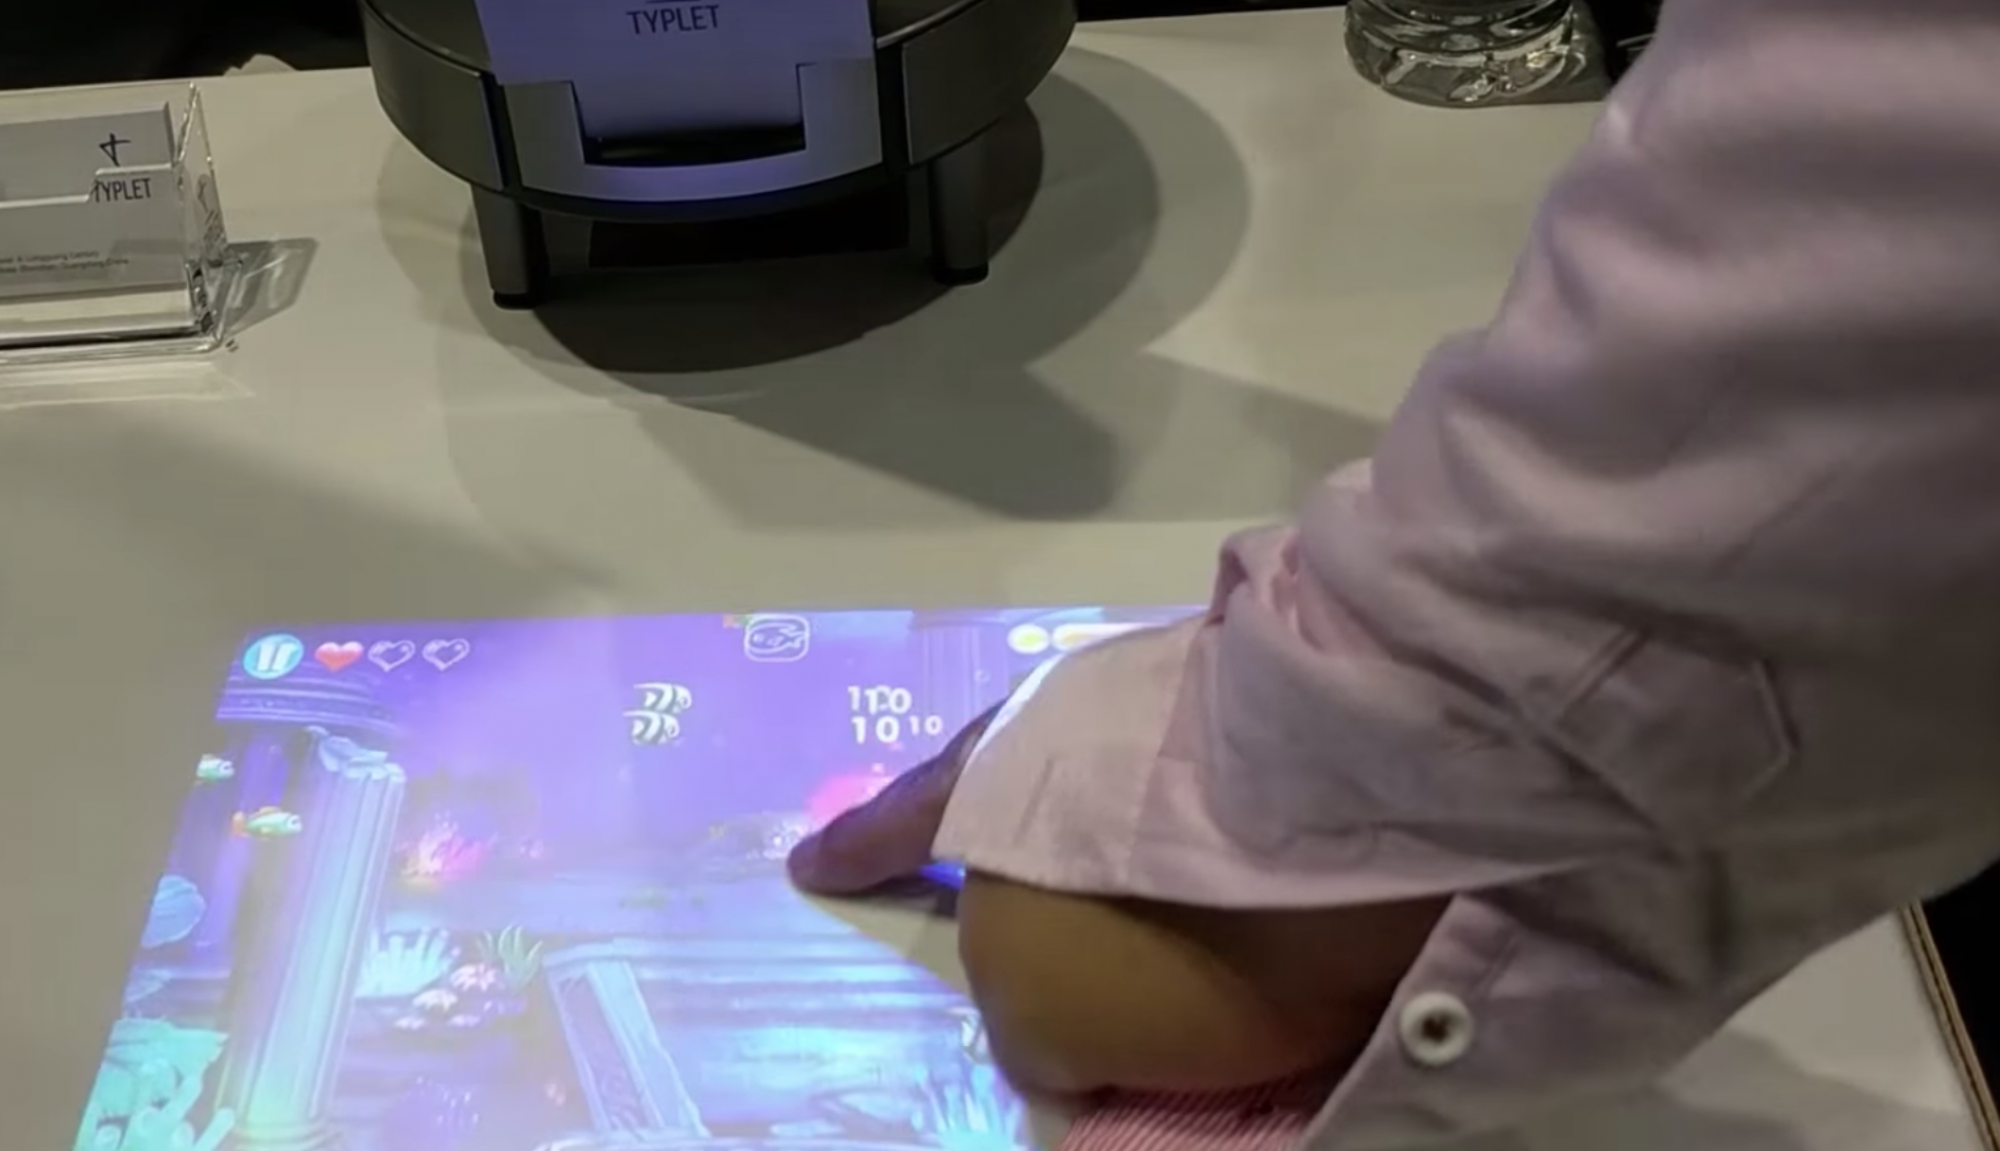
After presenting our design on Monday, I created a preliminary GUI pictured below for our Matlab to Python pipeline that I was supposed to be starting this week. This will be used for our testing. This required setting up PyQt5 on my laptop.

I also upgraded to Matlab 2018b from Matlab 2016b so that we will all be using the same software.

After our design presentation, a TA or professor recommended that we do not use Matlab so that we can omit any possible delays from sending data back and forth from a Python script to a Matlab script. We decided to alter our design to reflect this change. Thus, my future task assignments have changed. I will be porting the color detection code from Matlab to Python next week.

We worked on taking more test data this week so that Tanu and I could have more data with which to test our detection algorithms. My team also spent many hours writing the Design Document that is due on Monday. We also worked on our schedule to reflect the feedback the professors sent out and redid our block diagram for the Design Document.

Since only my future tasks have changed, my progress is on schedule. We have decided to focus entirely on color detection for our prototype given our successes with preliminary test results with the LAB color space. All tests passed our metric requiring the detected coordinate to be within the 3/4 the radius of the red dot.

Isha Status Report 2-23

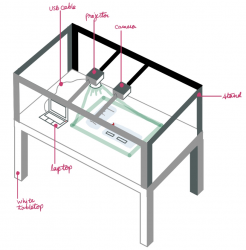
I helped my team set up our camera and projector and compile a bank of test images. We also worked on our presentation slides for the design review. Since I will be presenting, I have been writing a script for the presentation.

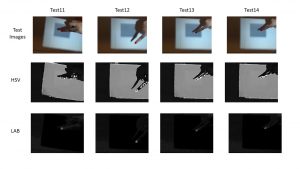
I have also been experimenting with LAB and HSV color space results. Right now, I am using simple thresholding with the new test data we took this week. Below is a table of results I have compiled. The red dot in the HSV and LAB images indicates the detected coordinate of the red dot. The HSV space result for image Test11 is significantly off the desired coordinate. I will begin to work more with the camera and test both color spaces with real time data. Next week, I hope to make a data driven decision to determine which color space would be best suited for our purposes. My progress is on schedule.

Team Status Report 2/23

Significant Risks:

Tanushree’s laptop’s hard drive had to replaced. This problem added a delay to our schedule despite her using cluster computers. Since her work mainly used Matlab, she was able to still work on cluster computers.

Our projector stand was not tall and stable enough to project on the lab bench. So to mitigate this risk, we changed the surface we project on to a poster board. We will now be creating a GUI for our final interactive poster.

Changes to Existing Design of the System:

We have made changes to our individual task assignments. Now, Suann is solely working on implementing Lucas Kanade, while Tanushree is focusing on blob detection. Further, Isha will be exploring different color spaces to decide which one best fits our purposes.

We received our parts much before the expected date. So we have started assembling our demo setup. This has allowed us to create a standardized bank of test images taken in our potential demo environment. Isha and Tanushree are both using these images as input for testing their respective algorithms.  Another advantage of having a primitive setup is that we have decided the color scheme of our GUI such that it suits our algorithms and prevents occlusions.

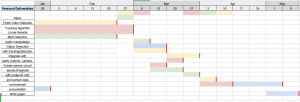
Updated Schedule