Stephen Dai’s Status Report For 12/9/23

Unfortunately this week I did not get to spend as much time on testing as I wanted. Because we decided to not implement diodes, I had to get rid of their classification from the code and dataset. I also ended up spending more time on the poster than we should have, but in my defense it was to make this awesome diagram:

Tomorrow I am going to do a lot more testing. Unfortunately some circuit test images will need to be redrawn because they contain diodes. Interestingly I noticed from the component classification testing that current source orientations seem to be working well, but not so much voltage sources. Hopefully I will be able to identify what could be the difference and what a solution for it is. Because there are no diodes now switches aren’t getting misidentified as diodes, but there does seem to be a rare case where a resistor/switch gets identified as the other. I will look into this as well and see if I can identify another solution.

Other than this our CV is in a decent state for the demo. As long as my group members have properly finished the integration and their parts, our demo should be good to go.

Stephen Dai’s Status Report for 12/2/23

This week I continued working on the individual component classification testing and the full circuit classification testing. The dataset is now complete and finalized representing 54 component subimages. I also factored in each orientation (left, right, down, up-facing) of voltage sources, current sources, and diodes into the code. To do this I had to not use the rBRIEF (rotated BRIEF) descriptors that ORB uses, but just the standard ORB descriptors. Unfortunately this required me to use the opencv-contrib extra modules, which required me to build the opencv library from source with the extra modules included, which took like 10-15 hours. In the meantime I used my python code for the testing. The good news is that the new component classification measurements are now ~94% on correct component classification, and ~79% for the correct orientation, which is now a raw component classification score of ~85%. It is not exactly the >=90% we originally outlined, but I am pretty happy about it. See the below graphs for some comparisons I made.

I also started doing the circuit classification testing. As of now I have only done 12 tests and 9 of them were correctly classified. Oddly enough what was the root of the problem in the three tests I failed was that switches could not be classified properly, which shocked me because in the individual component classification testing they were the most accurate by far. I am going to continue looking into how to solve it. It doesn’t seem like an issue with my individual classification testing because when I added the switch subimages generated from the circuit classification testing, they also failed, so I guess it just turns out that the ones used in the individual testing set were similar to those in the dataset.

For next week I am going to continue the full circuit testing and make some deliverables (graphs, tables) to show the result of the testing. I will also look into the switch thing and further classification improvements as I see fit. I am decently satisfied with the state of the computer vision and believe it is decently ready for final demonstration.

Stephen Dai’s Status Report for 11/18/23

This week I began creating integration code and continued to work on improving accuracy requirements. One of the things I did was I wrote a script to turn a directory of component images into a single YML file that can be parsed. Before/for the demo every run I would re-run image preprocessing and feature detection on every image in the directory, but now I have made it so that you create the YML file once and it can be parsed for the already-calculated feature vectors. The dataset file is bigger than I had anticipated and mentioned in the design report. In the report I mentioned that we would expect the file to be 500 KB large with a 50 image dataset. Right now with a 27 image dataset, the file is 1.4 MB, which means we can expect our 50 image dataset to be 3 MB large. Although this is larger than we anticipated, this is still plenty small. With the YML file there is added overhead because of metadata that makes it easier to parse the file like a dictionary/map lookup, so we are okay with this size tradeoff.

I have also started doing testing and polishing of accuracy. I ran a test on 66 component images, and 64 of them were identified correctly (~97% accuracy)! This statement isn’t exactly true though, because 42 of the images were ones that had orientation associated with it (voltage + current sources, diodes), and only 24 of those were identified with the correct orientation. Besides the difficulty in classifying the correct orientation of those components, I also noticed that current sources and voltage sources would have very similar matching scores (sometimes they had the same score but it just so happens the correct one was put as the first choice). As a result of this, one thing I want to experiment with is trying to use SIFT instead of ORB for feature detection. Because orientation actually matters, it actually makes sense to use SIFT now, so this is definitely something I want to try next week.

Last week I said that I wanted to improve the node detection, but I realized in testing this week that it actually performs pretty well. I played around with some parameters and it worked consistently.

My next steps are to continue working on the individual component accuracy and the full circuit accuracy as well. By the next report I want to have a complete dataset that will be used, and the accuracies will hopefully be in the ballpark of 80-90%.

Stephen Dai’s Status Report for 11/11/23

I made A LOT of additions/changes to the computer vision code this week. Here is an overview:

  1. If a node is detected but doesn’t have at least two detected neighbors, then this node is removed. This is done to remove stray circles that might be detected as nodes. By doing this, we err on the side of missing nodes instead of identifying fake nodes/circles. To account for this, we make the Hough circles transform less strict so it is more lenient in its circle detection.
  2. I changed the way that component subimages are generated. Before I created a hard-coded size box that had X by Y dimensions based on the coordinates of its nodes. Now, I do the following. I create a straight line from one node to the other. I iterate the line upwards + downwards / left + right (depending on if the component is horizontal or vertical), and I stop iterating once there are no black pixels in the line. Then I add a fixed value of 20 pixels, and now I have a box that is guaranteed to encompass the entire component.
  3. I finally found a good combination of preprocessing functions to run on component sub images. I spent so much time on this trying to find a way to remove shadows and the grain of the paper from the images, which were seriously messing up the individual component classification. The combination I ended up with was median blurring -> non-local means denoising -> adaptive thresholding -> median blur. From my testing this combination does really well in removing grain from the paper (noise) and smoothing out shadows. I don’t think I will stray from this combination besides fine-tuning parameters in the future.
  4. Before feature detection and matching, I have added an additional step. I run Hough circle transform on the processed subimage in order to determine if the component symbol is one with a circle (voltage source, current source, lightbulb). If it is, then feature matching is only performed with these components in the dataset. If it is not, then the component must be a wire, resistor, switch, or LED. I then perform probabilistic Hough line detection. I then look for the maximum and minimum X / Y coordinates (depending on if the component is vertical/horizontal) and see what the difference is. If the difference is small (less than a third of the subimage width/height), then the component must be a wire. Else, the component must be either a resistor, switch, or LED. I did these things because the individual component detection was quite sad. Sometimes a wire would get classified as a voltage/current source, which made no sense. I figured that because wire’s are so much different/simpler than every other component I could case specially on them and not even require feature matching for them.

The improvements I want to make next week are to make the node detection more consistent even with shadows. I think I will experiment with new preprocessing algorithms like what I did with the subimage preprocessing. The other thing I want to try to improve is the feature detection by tweaking some parameters.

Test that I have run and are planning to run look like this:

Node detection/subimage generation: I take images of drawn circuits and then feed them into my subimage generator. I validate that the detected nodes correspond to the drawn nodes by showing an image of detected circles overlaid on top of the circuit image. I also visually validate that the subimages generated properly encompass the entire component.

Component classification: In order to determine what image preprocessing algorithms I wanted to use, I tried many different combinations of algorithms and outputted/showed the image resulting of running each algorithm. This way I could intuitively tune what algorithms to use and which parameters I needed to change. In order to validate the output, I print the top three component classifications. Based on our use-case requirements, the top choice should be the correct classification 90% of the time.

Full circuit classification: I run everything together and print the output of the circuit classification, which is a list of the five best circuit classifications. Based on our use case requirements, one of the five classifications should be correct 90% of the time.

Next steps with my testing is to actually measure these results for a quantitative measure of how well my subsystems are performing. For the individual component classification, I will work with a testing dataset of 50 drawn components from our user group, and see if we hit the 90% mark. For full circuit classification, I will work with a testing dataset of 28 different circuit images from our user group and see if we hit the 90% mark as well.

Stephen Dai’s Status Report for 11/4/23

I finally finished the python -> C++ code conversion, and I am happy to say that the code is ready to be demoed! The things that I converted this week were the dataset parser file (which currently reads from images in a folder), the individual component classifier file, and the main file that classifies the entire circuit.

Tomorrow I will be experimenting with running the code on either Jaden or Devan’s laptops for the demo. I have been working on a Linux machine, and the problem with that is I don’t have a GUI installed that can show images, which I want to do for the demonstration (so I am not just showing std output). Also it would be much better if we could just run all of our code off of one machine anyways instead of switching computers every time someone presents their part.

The steps  for next week will to be to start working on testing and improving the accuracy of the circuit and component detection. The other thing is to also start working on integration with the mobile application. This will require creating a bridge file such that the C++ classes I made can be used in Swift. I also need to do a little bit of redesigning of the code, such as with the dataset parser. Right now I have it so that every time you run the program, the dataset parser will take each image in the dataset directory and generate the keypoints and descriptors. What we want to do is have dataset be represented by just one file that already has the keypoints and descriptors. This will honestly be a pretty easy change and coding this function will probably only take an hour or two max. I will also probably make this one of the last things I do because the dataset is not set yet.

I am on schedule. I foresee that maybe the improvement of the accuracy can potentially overflow into next next week as well, but we have given a slack period in our schedule that can account for this.

Stephen Dai’s Status Report For 10/28/23

I spent the first half of the week completing the ethics assignment and then the second half of the week on working on our project. I started the conversion from my python proof of concept of the CV portion of the code to C++. Originally my goal was to finish the conversion this week, but unfortunately I only finished converting the subimage generation portion. Unexpectedly I had much trouble properly configuring a development environment so that I could run the C++ code with the openCV library. This is the first time I have ever coded in C++ which is why I ran into this trouble and had to spend a quite a bit of time debugging code, learning syntax, and whatnot. I ended up using an AWS EC2 instance for where I do my development. The one problem with this is that I need an actual GUI if I want to see images and not just std output, but I to solve this I think I will try to use an X11 server. From this experience I have learned I really appreciate python for not needing explicit typing. The good news is that the subimage generation is 2/3 of the code, and now that I have an environment I can develop and test in, the rest of the conversion should be much easier.

My plan for next week is to finish the remaining conversions and begin running tests to benchmark accuracy and make modifications to improve the accuracy. As long as I can do this by the end of next week I should still be on track with my schedule.

Stephen Dai’s Status Report for 10/21/23

Because this week was fall break I did not work on much. What I did do was create the integration of the node detection and the component detection code, as well as making the code more modular for testing purposes. Previously the code that I had written for the node detection created output images (.jpgs) and then I had the component detection read in these .jpgs individually. Now the node detection will just read one image (the user input image) and then the circuit data structure is outputted.

A tool that I have to learn for my next steps is coding in C++. Right now the code that I have written is in Python, because what I have essentially done is just created the proof of concept for the computer vision. I need to convert this into C++ for compatibility with our Swift mobile application. A tool that I have already been learning for the computer vision algorithms is the OpenCV library.

Stephen Dai’s Status Report For 10/7/23

This week I spent much time and made good progress on the computer vision portion of our project! Originally in our schedule, I am to first do the individual component detection, but this week I opted to complete the full circuit detection in which I parse the original input image to generate the sub images for each component. I opted to do this because this will make it easier for me to test the individual circuit detection because I can upload drawings of full circuits instead of having to take individual photos of components. Also, by doing this I generate photos of the components that are more appropriately sized.

Here is the sub-image generation in action:

First the original image is greyscaled:

Then do some thresholding:

Then apply a median blur (see how just the nodes are left!):


Then use Hough Circle transform to find all the nodes (circles in white):

Then (skipping some steps here) generate individual component images by calculating bounding boxes for each edge (connection between nodes):


I also implemented the brute force feature matching to figure out the best matched component given an input image and a dataset of images. It actually worked better than I expected, successfully classifying 3/3 sub images, but obviously I need to do more testing. There is definitely a lot of stuff I want to tune still, and I want to try adding some blurring and more image preprocessing to see if the results are more definitive.

I am definitely on schedule. I purposely worked a lot this week because next week I have several midterms that will eat up my time, as well as the design report.

My next steps are to integrate the sub image generation and component detection so that I can work on the full-circuit re-creation and netlist generation. After this infrastructure is completed, I will start to fine tune parameters and whatnot in each step of the process.

Stephen Dai’s Status Report for 9/30/23

This week I mostly worked on the design presentation and finalizing our algorithm design for the computer vision as well as the user workflow. For the presentation I made these two diagrams to illustrate this:


We made a lot of pretty huge changes to our overall design, like creating a mobile application instead of a web application, and changing how the user interacts with our application. I designed how the user interacts with our application in steps as seen in the diagram. I also designed how our backend computer vision module works, also as seen in the diagram.

I also tried to work some more on getting the segmentation for getting individual components from the user image which Devan was working on last week. Instead of using Hough circle algorithm, I tried using Hough line algorithm and having intersections of the lines be classified as nodes. What I realized was that it was just not good enough: hand-drawn lines are too wavy for the algorithm and it detects lines that make up an actual component, like a resistor. So we are definitely sticking with Hough circle now.

Unfortunately I did not have time to work on the individual component detection as I spent much time on the design presentation. Next week I plan to work vigorously on improving the feature matching. I would say that I am a bit behind schedule than what I would like, but I am confident I can makeup the work next week.

The classes that I have taken that correlate to the principles learned for our design are 15112, 15122, 17437, and 18330. A class I have not taken that significantly impacts our design is a computer vision and machine learning related course. What I have been doing for self-learning is reading many computer vision and hand-drawing detection research papers and utilizing openCV documentation. Luckily there is a lot online and openCV has tutorials that have proven quite useful for me.

Stephen Dai’s Status Report for 9/23/23

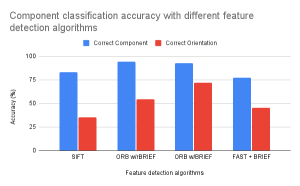
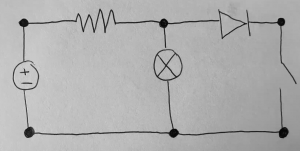
This week I researched different types of algorithms to use for feature matching in order to detect and identify individual electrical components. The two primary feature detection algorithms I considered were SIFT and ORB. From testing what I noticed was that ORB significantly handled variation in size and orientation much better than SIFT, and just had more features matching in general.

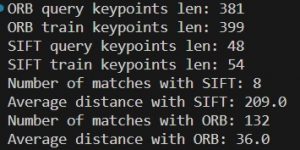
In the above photo you can see the results of using SIFT and ORB when comparing two images of resistors. ORB is clearly better with 132 / 381 matches, while SIFT only has 8 / ~48. Here is the visualization for the matches with ORB:

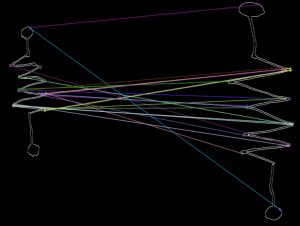
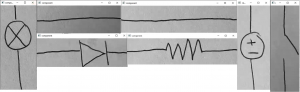
Note that the drawings of the resistors were first pre-processed with a contour detector that Devan found, which is why the background is entirely black and the contour of the resistors are in white.

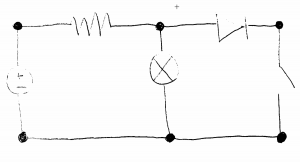
When I tried comparing a resistor that was aligned vertically and one that was aligned horizontally, this was the result:

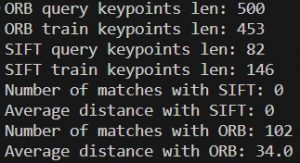
SIFT could not even generate any matches while ORB still could.

At this point I am confident that ORB is the algorithm we will use to generate FAST keypoints and BRIEF descriptors.

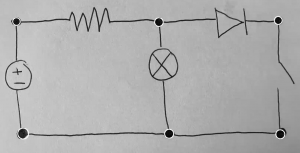
The one problem I have run into is that when using a resistor and voltage source drawing, the results of the matchings aren’t as polar as I expect them to be.

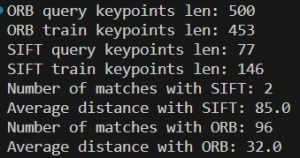
This is the result of comparing a resistor and voltage source drawing. If we compare to the matches of two similar resistors (first screenshot), we can see that ORB produces slightly less matches for the one with a resistor and voltage source. But, if we compare these results with two resistors of different orientation (second screenshot), they are pretty similar (~100 matches). While this may seem worrisome, I think that this is not too problematic because I believe the solution to this is to include various orientations of components in our training and validation datasets. This way, the matching of the same components in different orientations will be stronger and should contrast more with the matching results of two different components.

I am on schedule with my progress. I have established a good foundation with the algorithms to use for individual piece detection, and I want to continue exploring and tweaking to see if I can better improve the matching contrast with different components. Another thing I want to specifically try is using a different matching algorithm, as all of the above experiments used a brute force matcher. My steps for next week will be to create a reasonable feature vector with metrics that will be used to determine classification.