Unit testing throughout semester:
Strum Detection Testing:
In order to detect strums, we initially planned to use an audio-based approach. However, after Owen assembled the system and tested it, he found that the system was quite slow to respond, had an accuracy well below the 99% target, and was too sensitive to external noise. We found that for a beginner that will accidentally strike strings while moving their fingers or cause strings to chatter while playing, this method of detection would pick up on these noises and trigger a false positive strum.
We created a pick with an electrode and found that this method was far more accurate and was less intrusive than we originally thought, so we pursued this method.
Fretboard PCB Testing:
The fretboard PCBs were tested using a RPi Pico hooked up to a perfboard, as shown below.
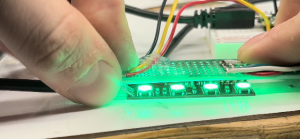
The Pico would provide the D-flip-flop various inputs and would analyze the output of the D-flip-flop. These inputs included things such as having the inputs rise at the same time, rising with varying delays, etc. The results of the tests were outputted on the LEDs on the PCB, where a green indicated a pass on all tests. This unit testing discovered a soldering flaw on one of the fretboard PCBs
Once soldered together the flip flops were tested by providing a signal that would shift a single “1” down the line of flip flops and probing the output of each flip flop using an oscilloscope. This revealed an issue with our first revision of PCBs, which we believe was due to timing violations caused by propagation time along the connecting wires. To resolve this, an RC lowpass was added between the output of each flop and the input to the next flop. This served the purpose of delaying the data line signal by around 1us with respect to the clock line. The second revision of PCBs had no issue with this test. The maximum short circuit current from the fret connection to ground was also tested and verified to be below 1mA, allowing us to be confident we would come in under the 1mA current requirement.
Pi Hat PCB Testing:
The Pi Hat was tested using various lab bench tools before ever connecting it to the Teensy or Pi. This consisted of connecting the 5V input to a lab bench power supply and measuring the voltage on the power pins for both the Pi and the Teensy. An E-load was used to draw the maximum expected current from each power pin as well to ensure the power distribution was functional. The logic level conversion was tested by connecting the Teensy, outputting a signal, and using an oscilloscope to measure the input and output to the converter. As expected, the waveforms looked identical other than the voltage being converted from 3.3V to 5V.
“Virtual” Guitar Testing:
While the final product has the virtual guitar synced to the user’s playing on the physical guitar, work on the virtual guitar was started well before the web app was communicating with the firmware/hardware. In order to do this, Ashwin implemented a “simulate strum” button on the web app which allowed for him to test the functionality of the virtual guitar without interacting with hardware at all. When we were ready to integrate the system with the hardware, we simply had to replace the simulate strum button with the signal sent from the Teensy. This made integration fairly straightforward.
Firmware Testing:
Since the full assembly of the guitar was not completed until later in the semester, Tushaar needed to be able to test his systems on other hardware. Within the first week of work, we were able to secure both a Teensy and WS2812 LEDs. This allowed Tushaar to test the functionality of the NeoPixel library for the Teensy, the function of the state machine using interrupts attached to pins, etc. With slight modifications to fix the issues with the Rev 1 fretboard PCBs, Tushaar was also able to test running MIDI files on a set of 5 fretboard PCBs and test the functionality of the finger placement sensing using a mini practice fretboard.
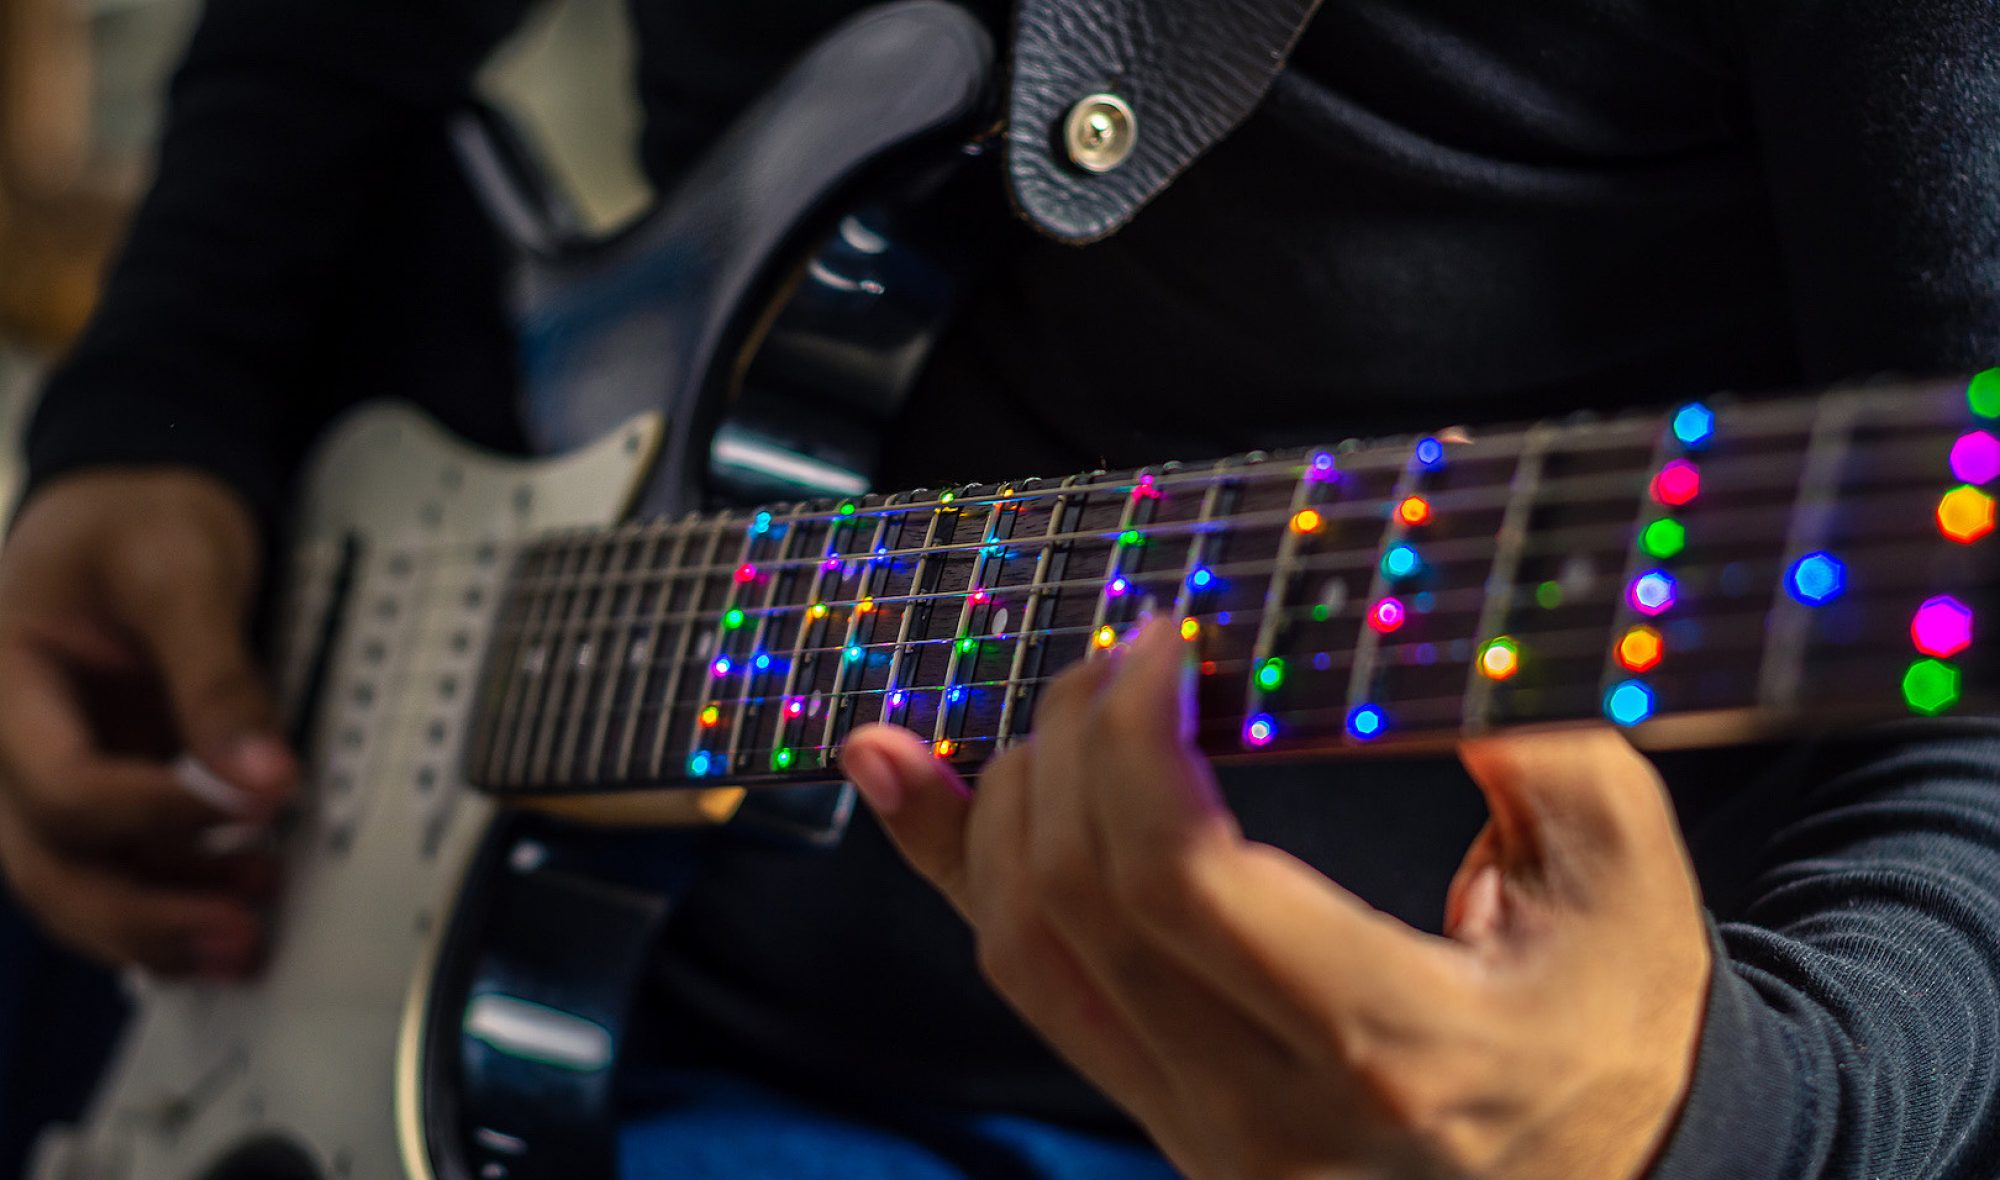
The first thing tested was the functionality of all fretboard finger placement sensors and LEDs. I did this by using Tushaar’s functions and writing some firmware to light up the LED under where the user is pressing. With this in place, I tested each of the 56 possible finger placements 5 times each, and the corresponding LED lit up each time the sensor was tested. This has also been continuously tested as we have been testing various songs on the guitar during integration testing. This means that the control of the LEDs and the reading of the finger placement is 100% accurate.
Firmware-Software Integration Testing:
The communication between the firmware and software consists of UART in each direction and a series of interrupts sent from the Pi to the Teensy on GPIO lines. We tested both forms of communication from the Pi to the Teensy fairly early in the semester by sending a MIDI file and verifying the byte count sent and received. Tushaar was also able to use the interrupts sent by the Pi to control the state machine. With this tested, the firmware and software were developed independently and were able to be easily integrated later in the semester.
Assembled Fretboard Testing:
After attaching all the fretboard PCBs to the guitar, Owen used a RPi Pico to control the fretboard LEDs. This allowed us to verify the functionality of all the LEDs on the system. Owen also once again used an RPi to send a series of signals to the D-flip-flops and used an oscilloscope to verify that each fret was driven high at the proper time.
System Testing
More details on system testing can be found in Owen’s report for 12/2/2023.
Current Through User:
Our requirements state that this must be below 1mA, which is why we implemented a 3.3kOhm series resistor for each fret. Testing was performed with a lab-bench ammeter capable of 0.01uA precision. The average short circuit (assuming the user is a 0 Ohm short) was 5.37uA. This dropped to approximately 0.80uA when put through various individuals. This is over 1000-fold below our target average current, so this test was a success. Average current is so low because the fret sensors are only sampled for a handful of microseconds, and the full firmware loop is on the order of milliseconds. A 47Ohm series shunt resistor and an oscilloscope were used to measure the peak short circuit current as 0.762mA, which lasts for 10us. This is ensured to be below 1mA by the series 3.3kOhm resistor and by a ~0.5V voltage drop on a diode.
By modifying Tushaar’s firmware with code to time the main loop, we were able to find that the system’s main loop time was 1555+-10us for both system modes (training & performance). This loop time directly corresponds to an LED refresh rate of 1555us, or 640Hz.
Strum to LED update delay was determined using an oscilloscope set to trigger on a strum. This was done by probing the string the pick struck (while the pick was at ~3.3V minus a diode drop) and triggering on a falling edge, meaning the pick has left the string. Owen then probed the LED data line and determined that there is a 1850us delay between the strum and when the final LED on the fretboard receives its data.
Current consumption was measured for each component. The results were:
Pi: 0.45A
Teensy + Fretboard flip flops: 0.12A
LED current at 1/2 brightness rainbow*: 0.39A
We found that the Pi drew far less current than we planned for, meaning the LEDs are able to be run at maximum brightness if desired. However, we found that maximum brightness was too bright for most users.
Strum rate was tested by strumming each string 200 times to the beat of a metronome and using the Teensy to count strums. I was able to strum up to 300BPM before strums began to be dropped (requirement was 200)
Buzzer audio level was 75 dB at the average user position
System battery life was tested while we were performing debugging of the web app (all systems were verified to be drawing nominal current despite the work occurring on the webapp). We found we were able to achieve around 3.5 hours of battery life without overdischarging the battery.

One thing discovered during this test was that after around 40 minutes, the firmware would begin acting strange. Owen and Tushaar were able to identify the issue as an overflow of the micros() function. Tushaar was able to resolve this issue by switching to the millis() function for determining note timing, which still provides more than enough timing accuracy.
User Testing:
In order to verify that we were meeting use case requirements, we tested the system on a handful of people with no guitar experience. We had the users play “Twinkle Twinkle Little Star” a handful of times. After interacting with the system, the users were provided with the following questions:
| Questions: | Points (1-10) |
| How intuitive is the interface? | 8.5 |
| How responsive is the website? | 10 |
| How aesthitecially appealing is the website? | 7 |
| How unintrusive are the guitar modifications? | 10 |
| How visible are the LEDs? | 10 |
| Responsive is the guitar? | 9 |
| How cohesive is the entire experience? | 10 |
The average values reported by the 5 testers so far are also shown. Overall the feedback was very positive and all the user testers felt the LEDs were effectively able to guide them in the playing of songs. We plan to continue user testing throughout this week.
Weekly Update
There are no risks jeopardizing the project. We have removed the scales feature from our target goals. While this likely would not have been difficult to integrate, we believe that the current system provides more than enough functionality for a beginner to get started with playing songs. No changes have occurred to the team schedule.
The main work this week was on fixing some minor issues with the web interface and adding statistics to the web app. We also added volume control for the metronome via the web app and worked on uploading numerous songs to the web app for demoing.
Most work this week was focused on the final presentation, poster, and prep for the demo.