
See the above links for our team’s design review slides and report.
10-12-2019 Post
Adrian Markelov:
This week I have been reading papers on time series classification (see presentation for samples) and reviewing deep learning design with pytorch from previous projects I have done. I would also like to answer a question asked from our presentation review. Why PCA before the deep net. The reason we need to compress the dataset before we put it through the deep net is simply because we do not have that much data. When you have any machine learning model that has a lot of parameters that need to be learned it is essential that the amount of training data vastly exceeds the number of parameters that need to be learned. If this requirement is not satisfied that model will over fit the given training data and will fail on then validation set and thus in actual practical use. Over time we will gather a large amount of data and remove PCA when it seems appropriate. Some simple testing with cross validation will tell use when we have enough data to not overfit.
Kyle:
This week was mostly slack for me, focusing on the design review and finishing up assignments for other classes.
10/5/2019 Update
Adrian:
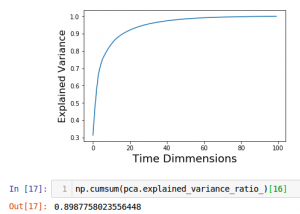
This week I have worked on completing the preparation and preprocessing of the data for the pytorch Conv net. This includes creating a system for sampling the data in a pytorch indexable manner, which is a little tedious due to the inconsistencies in the files that log workouts. To do this I have created a metadata system that matches desired buckets of data to their corresponding file. I also have started testing PCA compression on the data set and analyzing the last information. I have roughly determined that we can compress the data by 84 percent and keep 90 percent of the embedded information. Effectively going from (100*9) = 900 dimensions to to (16*9) = 144 dimensions. You can see the explained variance cumulative distribution function below and trivial see that most of the information is encoded in the first 20 eigenvectors along the time dimension. Note thought this compress was only sampled on a few hundred samples and might not be as good when we get to a few thousand. I have also determined that as of now a convolutional neural network makes the most sense now based on the format of data, see my explanation below. This week has not been as much work as I would have liked due to interviews., however progress has been made
Matt:
In terms of rep demarcation, after reading research papers containing a myriad approaches for finding “time series motifs”, we have settled on an approach that uses autocorrelation via dynamic time warping to find demarcations. This approach allows us to have a high degree of rep-period tolerance for when users slow down and speed up over the course of a set.
Kyle:
For the inverse kinematics problem of the human arm, I need to extract positional data from the IMU data. I tried to use regression to fit a line to the trend in accelerometer drift, in order to integrate the values and estimate position. I also worked out a simplified version of human arm kinematics, constrained to a watch as the end effector. However, the results were poor, and I decided that the whole joint estimation system would be less satisfactory to a user than just looking in a mirror, so it is being cut from the design requirements.
Why CNN’s vs RNN’s:
The decision to go with CNN’s over RNN’s is a hard one. In concept it is likely that both methods will work very well. As a matter of fact it superficially seems like RNN’s will work better as the are most commonly used for time series data. The assumption in our case though is a little different from normal time series data. In our data for a single data point (a single rep of a workout) the most important characteristic of the value of any dimensional value is the locational magnitude of where the watch is. This means that vectorized, a single vector index in one rep should correspond to the same euclidean location in workout space as another rep in the same index. This can be done trivially by scaling the data between the start and stop of a set to the same vector space where CNN’s can trivially be used. However, when we use RNN’s a very significant emphasis is put onto the difference in time between samples as adjacent data points are now in the bases of time difference vs location difference. The form of a rep is completely independent from the speed of the rep, good form can be both fast, slow or medium. Thus, it will be very difficult for a RNN to see outside of this because data in the same
Update 9/28/19
Adrian:
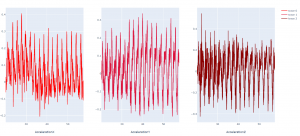
So far, I have created the backend flask server that communicates with the iOS app. I have also created a suite of preprocessing tools that will be used to feed the imu data into the deep net for form detection. This includes segmenting sets from the various exercise routine files, then segmenting handmarked reps from the sets and finally normalizing the data by using 1D signal interpolation the bring all signals into a 100×12 dimension basis. This on average should minimize the destruction and “making up” of information because the average bicep curls is about 100 samples which is 2 secs (at 50hz sampling rate). See image below of the normalized data for a single imu time series.
Kyle:
So far, I have developed a tool to parse and visualize IMU data from the Apple Watch. The plotter uses the Plotly library. I’ve also begun updating it to use Pandas DataFrames, hoping for easier long-term use and higher efficiency in processing the data. I have also begun evaluating several different methods of extracting pose by IMU tracking, since there is no generic open-source library for doing so. This should eventually lead to doing inverse kinematics to estimate the joint angles of the user’s arm, which should allow us to give the user visual feedback.
Matt:
Intro
Hi! Welcome to the project Kinisi page. We are the Apple Watch Exercise Form Correction Coach‒a product that allows you to exercise with your Apple Watch and receive intel on the form of your training. For each workout you do, it will analyze your form, tell you if you have good or bad form, tell you what exactly is bad about your form, and finally show you a skeleton of your form vs what your form should look like. Between the graphical and instructional data you receive, you should be able to improve your training and take it to the next level.
To deliver this product, we will need to provide a user interface for you that allows you to navigate the app and understand the feedback well enough to correct your form without external guidance. Next, we need to be able to automatically demarcate reps in a workout set. Then we need to be able to classify the issue the user is having from the demarcated data of each of their repetitions. Finally, we need to provide them with instructional and graphically generated feedback of what they are doing wrong, what they should be doing.
Proposal Slides
See our proposal presentation in the link above!
Hello world!
Welcome to Carnegie Mellon University: ECE Capstone Projects. This is your first post. Edit or delete it, then start blogging!