Yuchen’s Status Report for 2.24.2024

This week, I’m focusing on learning how to utilize Vis.js to manage our datasets and visualize the power flow and dynamic loads within the microgrid. Tackling the microgrid’s visualization is the most complex aspect of the web application, prompting me to prioritize it. Although I explored various open-source projects related to microgrid visualization, I found that integrating them poses significant challenges, and they lack the interactive capabilities we desire. Therefore I’ve switched my plan to building a new visualizer instead of integrating others.

For inspiration, I’ve explored several websites, including https://www.renewables.ninja/, which offers users the flexibility to adjust variables such as wind power, photovoltaics, weather conditions, and even select specific locations on a map. Currently, our minimum viable product (MVP) only accommodates location inputs. However, incorporating these additional customization options would be an excellent stretch goal for our project.

Unfortunately, my productivity dropped this week due to illness and the concurrent scheduling of my midterms. However, we had anticipated potential delays by incorporating some slack time into our schedule, allowing me to recover lost ground efficiently. For next week I’m aiming to finish the visualization of the microgrid before spring break.

Yuchen’s Status Report for 2.17.2024

This week, my focus was on exploring potential visualization methods for the gridlab-d file based on user input. While researching, I came across an open-source visualizer at https://github.com/jdechalendar/glm-plotter/tree/master/glm-plotter. However, integrating it into our project might prove challenging due to its reliance on a heavy web framework with Python 2 and outdated libraries. Additionally, it lacks functionalities essential for our needs, such as visualizing power flow and incorporating other features.

As a solution, I propose developing our visualization tool using node visualization tools. One promising option I’m considering is https://visjs.org/, a dynamic, browser-based library tailored for handling large datasets and facilitating data manipulation and interaction. My next step involves exploring its suitability for our project requirements and evaluating its potential integration.

Yuchen’s Status Report for 2.10.2024

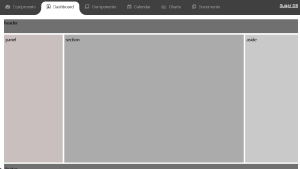
This week, my main task involves creating a preliminary template for the website’s main page, focusing on integrating the Generation and Load forecasting time series panel and the power flow network graph panel. The current website is built on the Django framework. I’ve attached a screenshot showcasing the current design progress. As you can see from the screenshot, we plan to separate various content elements, such as current machine learning outputs and forecasting results, into different tabs. This strategy aims to enhance user experience by reducing visual clutter, addressing a concern from previous design iterations.

The next step entails researching methods to enable users to upload their microgrid architecture files on the website and visualize nodes. This involves studying efficient techniques, such as utilizing a Python parser, to extract information from the user’s architecture file and generate visually appealing visualizations of the data.

Yuchen’s Status Report for 2.3.2024

As mentioned in our week’s team status report, we are in the stage of collecting the appropriate datasets and researching the complexity of the model, etc. This week, I’m responsible for the website setup and looking for data sets regarding wind direction/speed.

We’ve also decided on a clear division of labor that I will be broadly responsible for the final Web application, and I’ll also assist Carter in the ML model training process.  Regarding the final web application side, since it’s been a while since the last time I built a website, I plan to do a quick overview of CSS just to be more familiar with the format as well as UI-based libraries such as React.  In addition, I plan to start designing the front-end web interface using Figma and research how to load users’ microgrid architecture files on the website and possibly enable the user to edit the file on the website with visualization. On the ML side, I’m researching on previously done work as a reference and start to think how to implement our model in the near future.

Team Status Report for 2.2.2024

Current Challenge Overview:

Our primary challenge involves understanding what data we need and collecting appropriate datasets. We’re currently looking for localized time-series data relating solar and wind power statistics to weather patterns and using it to train a model for renewable generation and load forecasting. Selecting the right location is also and we are currently planning to choose representative states in the U.S. to cover most use cases. Additionally, we’re navigating and researching the complexities of integrating generic microgrid standards and power flow modeling programs. Risk management is a priority, and we’re developing a robust backup plan in case data collection encounters obstacles.