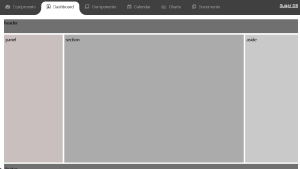
This week, my main task involves creating a preliminary template for the website’s main page, focusing on integrating the Generation and Load forecasting time series panel and the power flow network graph panel. The current website is built on the Django framework. I’ve attached a screenshot showcasing the current design progress. As you can see from the screenshot, we plan to separate various content elements, such as current machine learning outputs and forecasting results, into different tabs. This strategy aims to enhance user experience by reducing visual clutter, addressing a concern from previous design iterations.

The next step entails researching methods to enable users to upload their microgrid architecture files on the website and visualize nodes. This involves studying efficient techniques, such as utilizing a Python parser, to extract information from the user’s architecture file and generate visually appealing visualizations of the data.
