This past week, I researched frameworks to use to improve our UI and began working on the output GUI.
For the first half of the week, I planned to make a python GUI that runs on the ece machines, but after I ran into many issues, I decided to make a web app instead. The first issue was that the library choices I have are quite limited (most libraries aren’t installed on these machines, and I don’t have permission to install anything). After I settled on Tkinter and Matplotlib, two libraries that are already installed, I ran into package dependency issues and bugs that have been fixed in newer releases, but not in the old release on those machines.
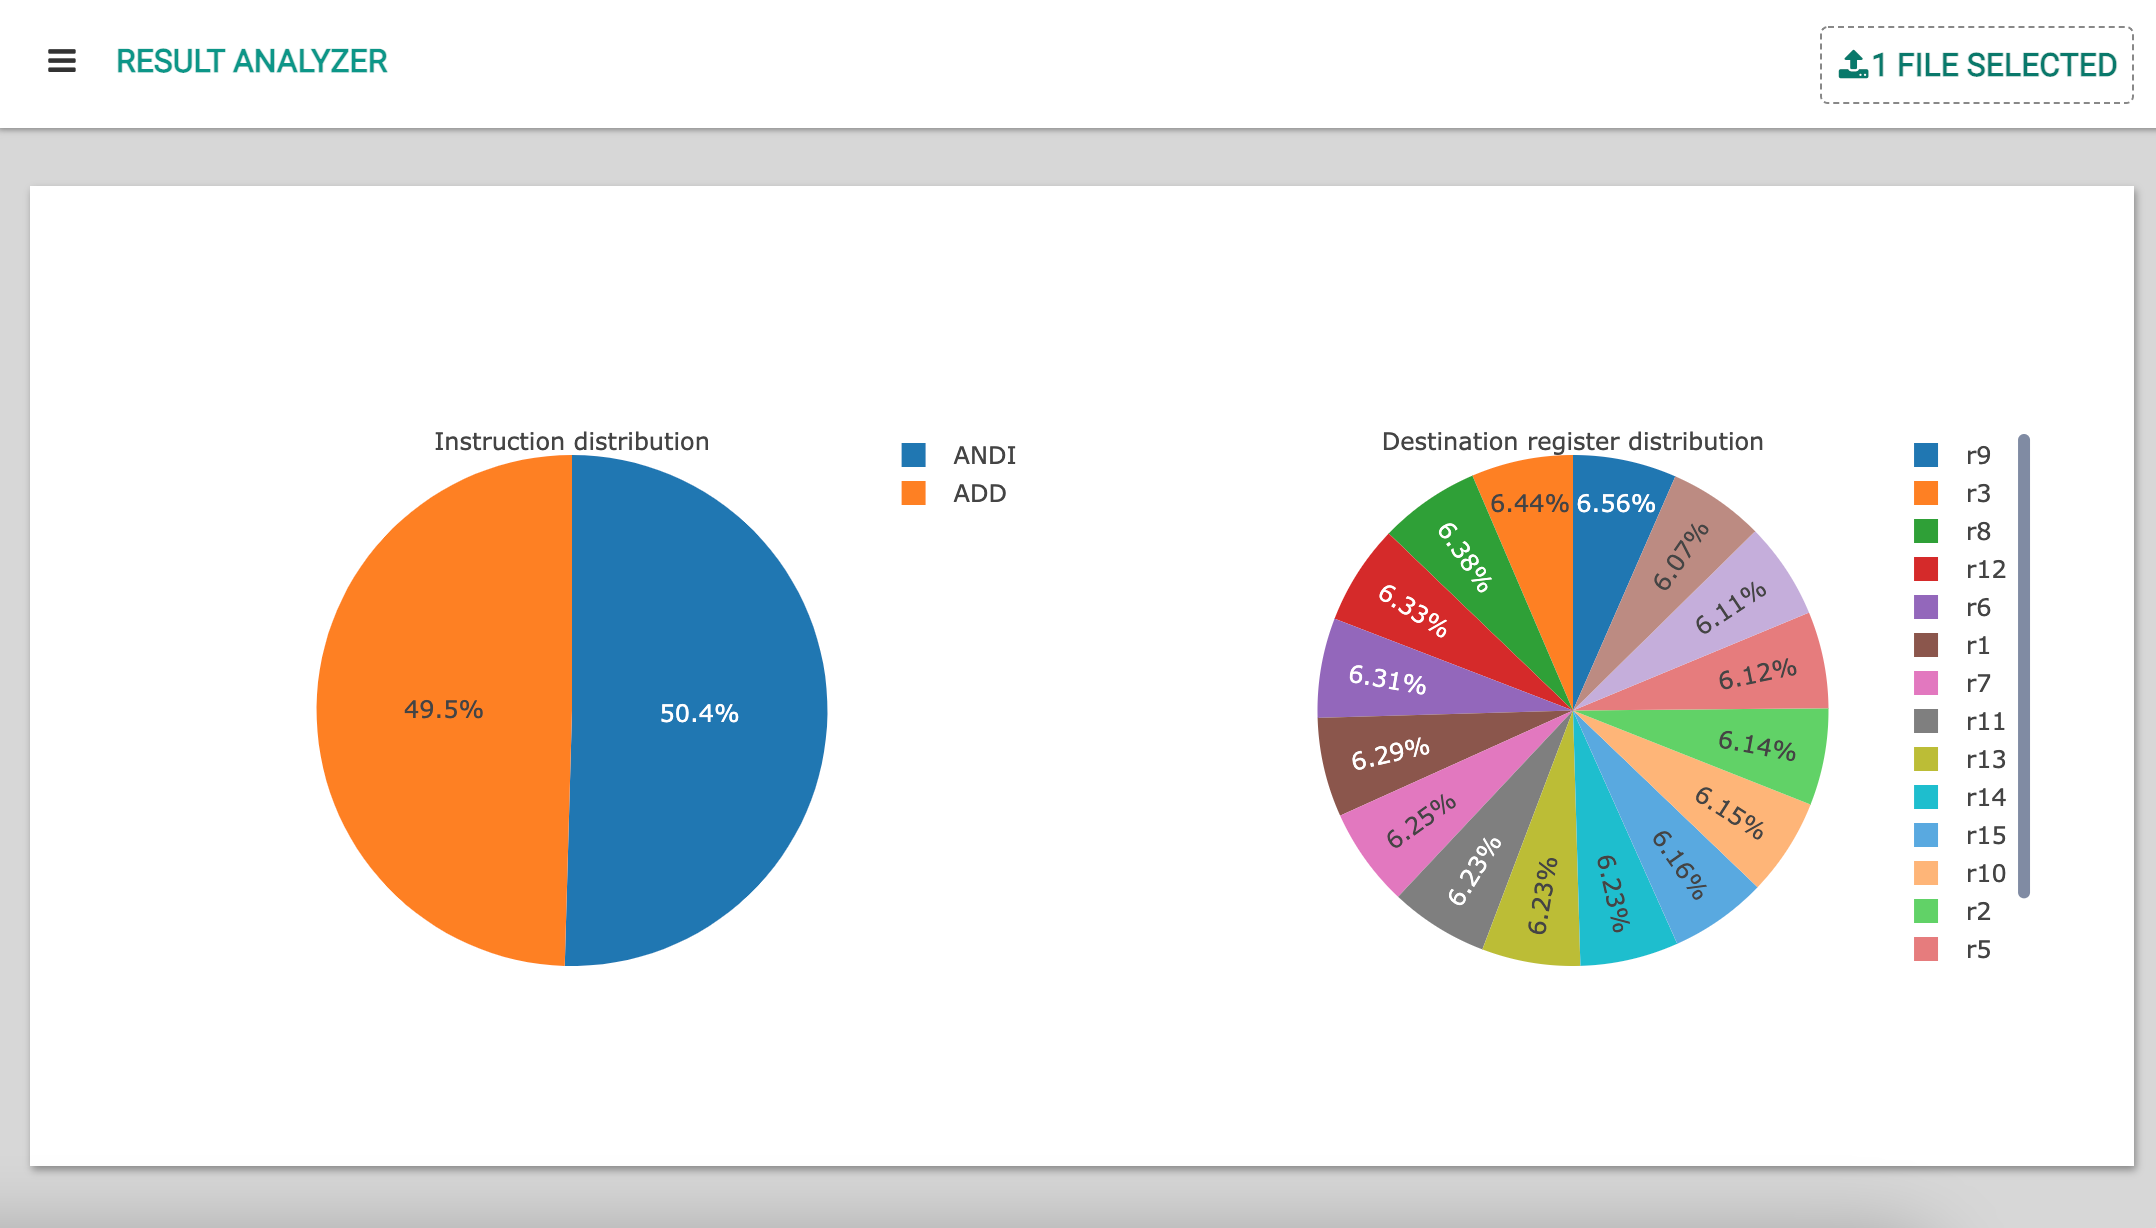
Getting even a simple plot to show proved to be difficult, so my plan switched to making a web app instead in the second half of the week. However, given that I do not have web app experiences, I want to use a web app builder to simplify the process. I discovered a web app builder called anvil, that allows me to make a UI by dragging and dropping components and code client and server side code in Python. I’ve since been playing around with this framework, and here’s what I’ve been able to get to work so far:

This is showing that the user can upload a test case file and get some graphed statistics about that test case.
I am on schedule. Next week, I will continue building this GUI. The goal is for the user to be able to upload relevant files and see more statistics about the test case as well as a failure analysis (what instruction, if any, failed, plus a table comparing the expected vs actual register dumps).
