Schedule
Official Project Management Schedule Updates
- IN PROGRESS Backend Testing
- DOING Pitch analysis testing
- DOING CQ change analysis testing
- ‘testing’ in this context doesn’t really make sense, but I will be visually verifying that a trained opera singer has a CQ closer to the idealized CQ range than an amateur singer
- IN PROGRESS Inform about Change in CQ
- IN PROGRESS Final Demo Video
Pitch Analysis
- DOING: test all ‘Happy Birthday’ repertoires’ accuracy
- DONE: add function to output pitch based on the mouse’s position
- If I am understanding correctly, the frontend can pass the mouse cursor’s “x_pos”, which would represent a frequency value, to the backend. The function I wrote, get_pitch_label(), takes this value and converts it to a pitch note for the frontend to display as a small label next to the mouse cursor
- Improved pitch detection accuracy to 99.49% for all scales
CQ Analysis
- DONE: add function to output values of ‘ideal’ female and male ranges
- Instead of a function, I added constants (one for female, one for male) to proc_data.py
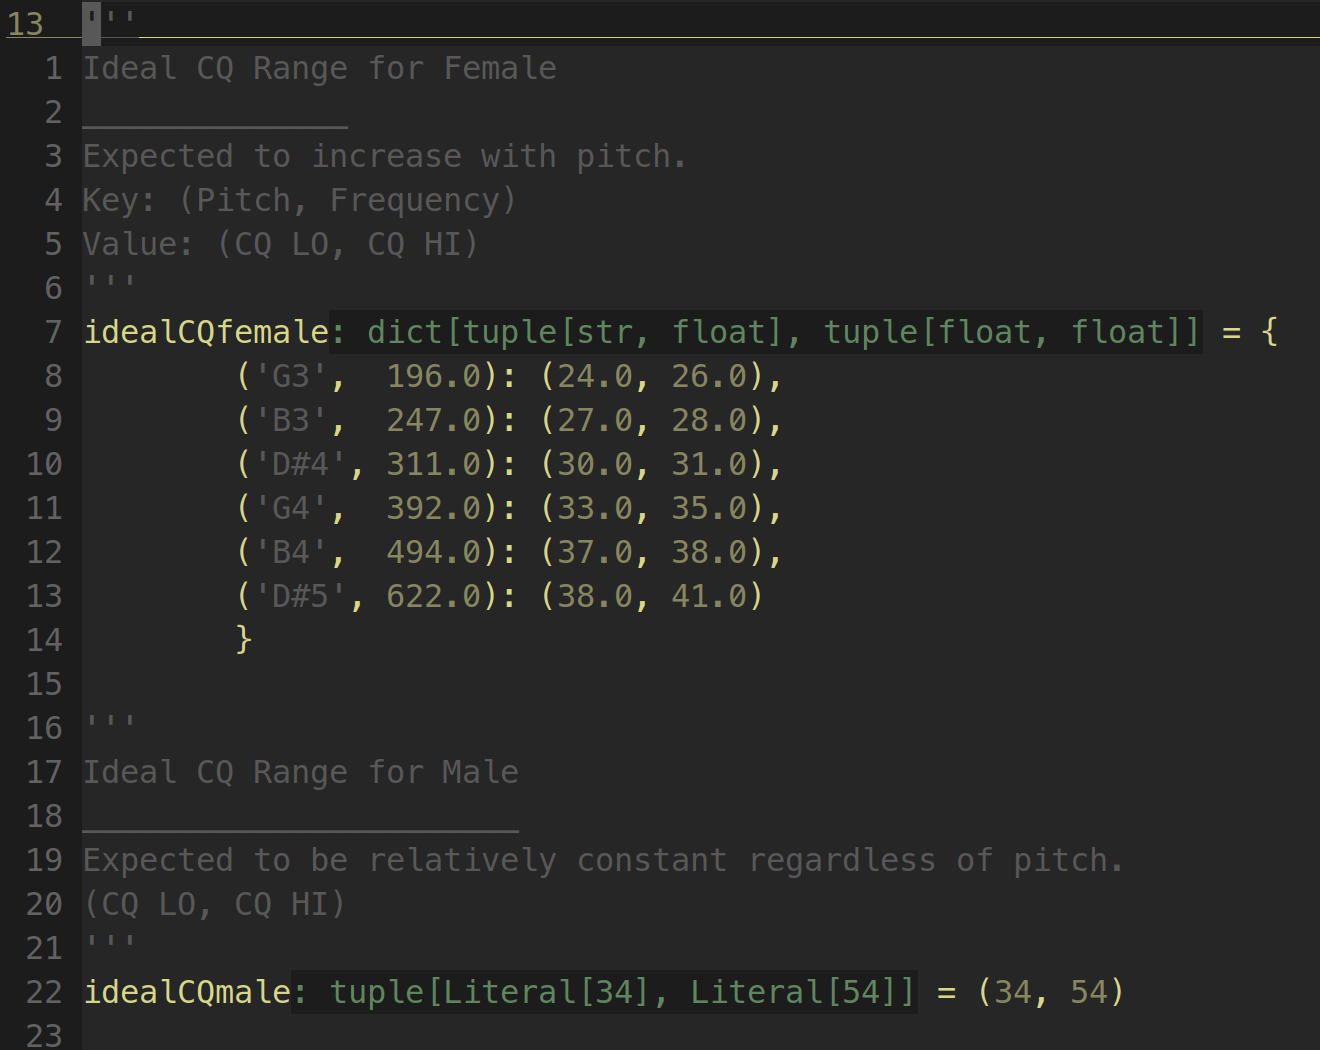
- This data was “recreated” based on the research papers by Howard. The papers summarize this data, but don’t explicitly give values for the summarized data. I had to create this summary with exact values and with slight modifications to fit our applications needs. For female data, I calculated two means (one based on all trained female singers, and a second based on only trained female singers with 10+ years of training) to compute CQ ranges. For male data, I made an executive decision to use the last session of the M1 (Male 1) test subject. The last sessions represents the recording session in which M1 had the most exposure to vocal training.
- While this tasks is computationally done, I will be meeting again with Susanna to ensure that the way I formatted the data is appropriate for the frontend to graph. I’m only concerned that because our research is limited to CQ measurements of certain pitches, that we will have to consider this when making the graph area look understandable to the reader. We can either fill in the “gaps” with a linear model, or represent only the concrete data in a “candlestick chart” style.
- TODO: Confirm ideal CQ data format with Susanna for frontend
Final Demo Video
- I recorded the footage I need for the final video
- TODO: Record video script narration
- TODO: Edit and publish video