Please find the link to our video demo detailing our final demonstration:
We are excited to host a live demo tomorrow, Friday, May 3rd at Wiegand Gymnasium, and we hope to see you all there!
Carnegie Mellon ECE Capstone, Spring 2024 by Grace Liu, Steven Zeng, and Surya C
Please find the link to our video demo detailing our final demonstration:
We are excited to host a live demo tomorrow, Friday, May 3rd at Wiegand Gymnasium, and we hope to see you all there!
As the semester comes to a close, this status report aims to provide a final technical update along with a quick reflection on some of the lessons we have learned thus far as a group.
First, in the interest of a technical update on our progress: we are still debugging the mySQLConnector in the process of integrating the separate algorithms that comprise our project. Namely, we need to implement the logic to encode the binary data sent from the generated image and decode this binary data on the server side before it is written into the database.
I was able to get the SSOCR (Seven-Segment Optical Character Recognition) working for still images; this would be used to communicate the scale readings to our database. Here is an example of how it works on a homemade test case:

Resulting output:

On the Pi-capturing end, the logic is to continuously capture and parse frames until a significant positive value is registered (something is placed on the scale). From there, a counter is implemented to let the weight standardize, and the image is sampled. This image is then forwarded to the database which parses the image (SSOCR) and writes the value into the database. Fine-tuning the SSOCR so it works across broad testing inputs remains a personal goal of mine in the coming week.
Another bucket list item we would like to work on is improving the front end of our website. Grace plans to take the lead on that as demo day approaches, with supplementary assistance from me and Steven based on our progress with mySQLConnect.
Some of the lessons we learned from the semester include handling the tradeoff between building your components for stages of the project versus buying premade parts. The tradeoff arises between speed and customizability, and in general, we tended to favor the latter given that we saw the project as an opportunity to apply what we have learned to build new things as opposed to learning how to use a premade system that may be rather restricted in functionality towards our use cases. Another lesson was the importance of documentation on a routine level: we found that status reports, weekly meetings, and report writing and assignments throughout the semester help maintain consistent progress in our project throughout the semester so that no point of the design process devolves into an unbearable time crunch. This is a very extendable skill for our careers beyond graduation.
We would once again like to thank the 18-500 course staff, and all the educators at CMU whose advice and guidance over the past few years of undergraduate study were applied in the development of our project. While there remain some outstanding intricacies to resolve ahead of the final demonstration, we are excited for the opportunity to show off our hard work throughout the semester in the final demo showcase this coming Friday.
The final list of items to complete on my end with the demo coming up soon include configuring the database, sending captured images to it, and slightly adapting this process for the scale measurement case.
On Monday I worked with Steven on writing some logic to auto-capture the image when the resolution is good enough. Thanks to the excellent camera quality (pictured below working on a watch for example), we’ve noticed better object recognition results/classification accuracies:

Again, the goal for this stage is just to generate a clear image to send to the database; the database will take care of proper recognition and update. It wouldn’t make sense to host such intensive operations on the Pi for performance reasons. With that said, it is nice to see that the algorithm classified my watch as an “analog clock,” with “stopwatch” being a somewhat valid classification all things considered.
The image is then saved to a directory and the mysql.connector() class of functions uses “blob” structures to send a relatively large set of data (an image) in the format of binaries that can be received and interpreted by the MySQL database.
Our web application implements AJAX (Asynchronous Javascript and XML) to render the user food entries on the website with corresponding nutritional information. It will render whatever is in the database, so the image will pop up on the user end when it has been entered into the DB by the application.
The other item to complete is the same process but for text recognition on the scale reading. This is easier because we just need to communicate scale numbers (much smaller data types than pictures) over to mySQL. It involves building off existing frameworks but modifying them around a digit recognition algorithm as opposed to image classification.
As such, our primary focus is trying to optimize and improve the accuracy of all the subsystems we have implemented thus far. Efforts have been more group-oriented now than ever before so we can patch up the areas that need improvement to allow for as smooth a demo as possible.
This was a busy yet exciting week for our group in preparation for the interim demonstration. I continued work on the hardware and classification components of our project with the goal of shifting to integration in the coming weeks.
Operating the RPI in a “headless manner” continued to offer its own challenges. Interfacing directly with the board required an SSH connection and a remote viewer (typically RealVNC), which would be quite slow at times. As such, observing the camera performance through the SSH connection resulted in significant frame lag and limited resolution. My goal for the coming weeks is to improve our camera performance through a headed monitor setup and try a USB camera as opposed to a 3rd party vendor (Arducam).
Dependencies associated with classification hardware:
Resulting camera’s first image!:

To elaborate, the plan would be to automatically “capture” an image once the algorithm is 80 percent (or higher) confident that it has classified the object correctly. The formal classification operates on the backend, but an 80 percent benchmark from this rudimentary algorithm I’ve implemented on the RPI typically indicates the image is of sufficient quality, so it is a good heuristic for image capturing. The resulting image then needs to be sent to the database. Once our web application is hosted, I’ll add the IP addresses of both RPIs to the database to allow it to accept images from our RPIs. The user will then have the option to reject or accept the image if it is not of sufficient quality. I will implement these steps as soon as the new cameras come in (probably next week).
Verification in the context of hardware consists of an evaluation of classification accuracy and latency considerations. There are inherent design tradeoffs between algorithm complexity, hardware limitations, and the overall usage time scale we want the product to be operated within.
This also entails evaluating system performance under various environmental conditions. Namely, we plan to conduct tests under different lighting conditions, angles, and distances to understand whether the algorithm maintains consistent accuracy and latency across different scenarios.
We are looking for an 80 percent confidence metric on the hardware side given that it just needs to take a clear enough picture and forward it to the database. So verification will entail checking that the classification accuracy meets or exceeds this threshold while maintaining respectable latency. Finally, it is important to balance quantitative verification with qualitative verification, so we will rehash these ideas once more with Prof. Savvides and Neha (our assigned TA) to build a thorough verification of system performance on the hardware end.
Our progress is coming in well on all fronts and I am excited to continue improving the performance of our design.
We shifted our whole focus into our demo and getting our individual components to work. A big thing that we discovered in all our components were a lot of underlying issues that came when integrating into our project. All the testing was local and independent, so we ran into a lot of complications.
A few complications arose from our ML design. The first being the difficulty of using the ChatGPT API to take in images and process them. It was slow and hard to input an image efficiently. Furthermore, our local tests for some of the ML classification schemes were difficult to integrate into the Django web app. As a result, we had to shift base and adjust on the fly. This included using some backup plans we had such as using pre-trained data sets and classification APIs. The big issue with these were the configuration issues that we spent hours dealing with and making sure we had everything installed to the right versions. Lastly, we decided to change our fruit testing data to oranges, bananas, and strawberries instead of apples. We hope this change allows us to move on from classification at the moment and shift our focus towards label reading and OCR design as well as hardware integration.
Surya made major progress in integrating the Raspberry Pi and configuring it with our internet. The major issue is configuring it with CMU wifi which is the primary issue right now. However, he was able to set it up with the ssh server and download required packages for the video stream. We shifted focus to doing a lot of computation on the Raspberry Pi itself to add into our designed trade studies. We hope to show all of these in the demo to showcase our experimentation process. Surya lastly did a lot of work configuring MacBook settings to run our website with all the required packages. There were many hardware issues that he had to resolve and fix to even get the website to run. Ultimately, the website was able to run successfully on his computer and classify images to an acceptable accuracy.
Lastly, Grace was able to create a new Gantt chart schedule that reflected changes in our schedule that had to be made since several technical challenges were encountered during our testing process. While there were some unexpected delays with the OCR libraries and hardware configurations, we remained on track in terms of our original project schedule with the appropriate allocated slack time and abilities to adjust to such changes. Since we added additional features and ideas to our project throughout the capstone process including the in-class ethics discussion, some slack was allocated towards those features and some extra time was spent handling unanticipated technical issues. Ultimately while schedule changes to our project were necessary, they ended up contributed a lot towards our ability to work together as teammates and also learn to adapt to necessary changes to adapt to our project framework.
We hope to have a productive demo next week and take in the feedback of everyone to get closer to completing our final project. Likewise, we will start drafting the final report.
With the interim demo coming up in a few days, we spent significant time this week working together as a group and ensuring we have a functional subsystem to demonstrate for the coming days.
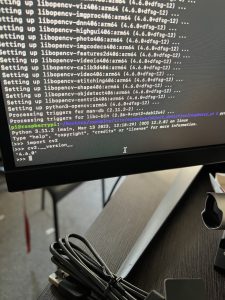
The primary feature of our demo is showing our algorithms at work hosted on a local website. An interesting complication that we have run into, however, is the incompatibility of certain backend packages we are using, both within the Django framework and our physical computers. Because the M1 MacBook chip has a different layout for instruction sets and architecture than your standard Intel chip, some of the Python packages cause segmentation faults and hold microinstructions that cannot be executed on an M1 CPU. The fix to these, unfortunately, involves painstakingly resolving each dependency by version matching and reading documentation on compatibility. Another important factor is to learn how the DLL (Dynamic Linked Library) translates back and forth between Python and a low-level language that the computer can interpret to execute an instruction. There are compatibility considerations with this stage as well; this is something we are all working to fix together in advance of our presentation. An example crash report can be found below:

Regarding RPI integration: We tried a “headless” setup which is a workaround involving writing the WiFi parameters under a customized OS setting and performing the rest of the setup through SSH. After some unfamiliar debugging, I was able to get this to work on my local wifi settings. I will need to ensure this works on CMU wifi by registering the device under CMU-DEVICE Wifi.
Our goal is to have a video stream present on the webpage, with the separate stages of the project implemented as separate pages on the web application. Our Gannt chart and workflow have changed around when the hardware comes in and subsequent integration; I would say we are working more together on each of the subsystem components to ensure that we meet MVP. We plan to focus on hardware integration when the software is fully complete (by our interim demo, more or less).
With parts needed for the scale integration coming in this week, this provided a good opportunity to get my hands dirty on this component of our design. These include the Arduino Mega, 2 ArduCam cameras, a physical scale, the ESP wifi chip, and HX711 amplifiers. I am still waiting on the RPIs to integrate with the ArduCam cameras; to recap from last week, I plan on trying 2 different implementations and seeing which method works better.
For now, I will emphasize our original implementation plan: to remove the casing on the scale, disconnect the load cell wiring from the original Wheatstone arrangement, run the 4 load cell wires into the amplifier, which would then feed into the Arduino and subsequently the ESP. From there, the ESP would just need to generate HTTP requests as I have scripted in the code I wrote last week. The factors that I am wary of include not damaging any sensitive equipment in the process of rewiring the scale. I plan on snipping the wires from the PCB in the scale as opposed to desoldering them because the last thing I want is there to be frayed copper at the ends of these connections. I hope Techspark has some heat-shrinking plastic casings that I can keep around the connections I need to resolder so that the bare ends are preserved somewhat. If any of these connections are challenged or compromised, the scale cannot be used, so that is a consideration I have in mind when working on this. Here is an example of the material (in black):

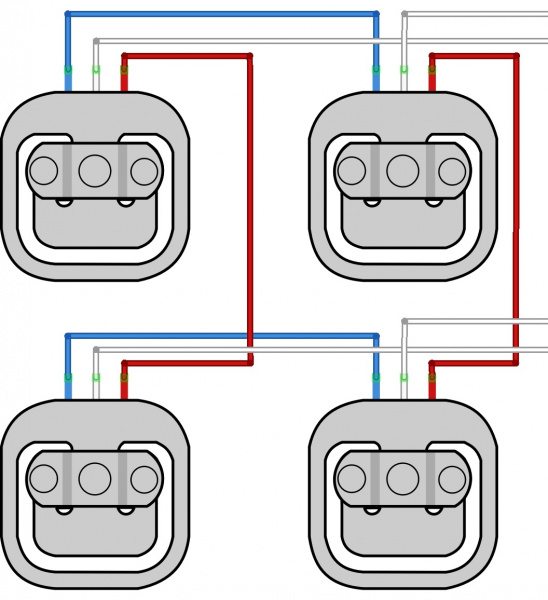
Figuring out the wiring between the amplifier and load cell was also a bit nonintuitive for me. Here is a sample diagram that I plan on using to ensure the reconnections are going to the right places. To keep things simple, red will match with red, blue with blue (these are the wires that “talk” to each other to get the total aggregate weight from all 4 load cells), and I’ll send the white wires to the amplifier. I adapted this from the documentation on the load cells:
I have slowed down work on our web application; I think it is up to a point where all the basic functionality is present, and as a group, we will have to build the rest of the application around the hardware we will implement. One theme readers may observe across the group this week is a shift towards implementation hardware as the backend frameworks are in place.
In parallel, I will have conversations with the group to build an idea of what we want to show off for the upcoming interim demo. Overall, we are on track with schedule but we recognize that the next few weeks are essential to the completion of this project.
With the interim demo coming up on April 1st, coming out of Spring break with a clear plan of attack was important for our group. We spent this week planning out some of the main features we would like to highlight for the interim demo; furthermore, with a realization that the interim demo is a presentation of an intentionally incomplete product, we spent some time deciding how the features we decide to demonstrate will interact with one another.
Surya continued work on scale integration and helped Grace tidy up the web application. In addition, he developed potential approaches to scale integration through a block diagram as seen below:
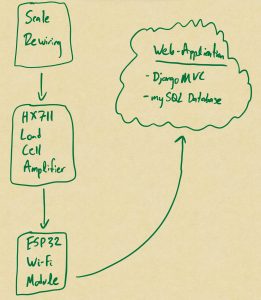
Scale integration can be done either by hacking into a scale and forwarding values through a microcontroller, or through an OCR on the digital scale reading panel. In evaluating the first option, a strong understanding of scale hardware is required before it can be opened up. The main aspects he focused on were the difference between strain gauges and load cells, how and why they are configured in a Wheatstone arrangement, and the rewiring necessary to forward the load cell measurement through an amplifier and into a microcontroller such as an Arduino.
Given the delicacy of this process and the surprising nuance of hardware behind camera scales, he discerned that an OCR model reading the segmented display panel of the scale may be cleaner to implement for an MVP. This, however, presents its own challenges. Images require more memory to deal with than a stream of bits representing scale readings, so latency becomes a pronounced issue. Furthermore, the accuracy of digit classification is an additional factor that is simply not a problem when one is simply forwarding bits to and from components. The counterargument to this approach is the reduced potential of damages, and for the sake of the MVP and wanting an operational scale as first priority, this is a significant consideration to keep in mind.
In either case, because both options are largely cost-effective, Surya began ordering parts common between both approaches and plans to get his hands dirty with both approaches to see which method works better for the application over the next 2 weeks. He encourages readers to view his weekly status report for more details on the above design plan for scale integration.
Steven made significant progress in testing various ML methodologies. He was able to determine that soft-margin SVMs was not effective enough to include in our implementation. However, the SVMs have provided nice decision boundaries that we plan to use for our backup option: AdaBoost Algorithm. This algorithm establishes weights for varying decision boundaries, so it takes into account multiple boundaries. He was able to research the math and coded up the preliminary functions to compute the weights and train the model.
Steven also shifted a lot of focus into working with GoogLeNet and working with a k-nearest neighbors approach to boost the accuracy of the algorithm in the classification of different fruits. He plans to work on testing next week as well as validation. We hope to have all this tested, and the results analyzed in no more than two weeks. However, another goal next week is to integrate the GoogLeNet classification algorithm directly into the website without any modifications to test the compatibility as well as the preliminary accuracies and latencies.
Regarding progress in integration, Steven did research on ChatGPT4. We are currently hesitant on purchasing the API to save some money. However, Steven wrote the pseudocode for integrating it into the front-end. Likewise, he looked into creating formatted responses given images and formatted inputs. Steven will also begin shifting focus away from local testing on his MacBook Camera and work closely with Surya and Grace to take Arduino or Rpi images and/or images from the website.
Grace was able to take this week’s ethics assignment and apply it towards public safety and public welfare considerations. We realized food tracking applications could induce negative side effects for users with high self-discipline, so an additional globals page could help promote a body positive environment that shows users what others are up to as well. A caption can also be added so our web application is used more as a social media, but of course this is optional for users and they can always choose to opt-out. With this potentially being more on a global scale, I want to consider larger options for file uploads to be able to accommodate this. One option is instead of using the web application’s file system, a content delivery network could be used since their servers are scattered around the world. This would definitely help improve speed and performance of our web application in the long-run.
Coming off break and getting back into the swing of things, this week offered an opportunity for us as a team and individually to reflect on our progress to meet our NutrientMatch MVP. Entering the project work period where we had an ambitious idea but were largely uninformed of implementation strategies, we are in a much better space now as we have taken a deep dive into building the stages of the design. For me, this was a week where my preconceived notions and ideas of integrating the scale into the project were challenged, and I considered alternative options in the form of risk mitigation and to complete our MVP. I’d like to dedicate this week’s blog posts to explaining what I learned and subsequent approaches.
Our first idea to integrate the scale with a remote database (and subsequent display to a custom website) involved a physical scale, signal amplifiers, microcontrollers and logic, and a WiFi chip which would make requests to a backend engine for website rendering. The first design consideration was whether to build a custom scale or hack into an existing one. We favored the latter, as scales built in the market today are more complex than one would think, and have several nuanced electronic components that ensure the measurements are accurate. The downside to this approach, however, is the lack of customizability given the scale is prebuilt, and the fact that we would need to exercise extreme caution so as to not cut the wrong wires or the solder components to the wrong sections of the scale.
The next step involved rewiring the load cells to run through an amplifier. A load cell is just a component that translates experienced mechanical force into a signal to be interpreted digitally. When running these signals to an Arduino for display, the signals themselves are typically low in amplitude compared to the sensitivity of the ADC input of the microcontroller; hence the need for a load cell amplifier.
For testing, a nice thing to do would be to wire the load cell amplifier outputs to a 7-segment display, just to get an idea of the numbers we are dealing with. In implementation, the next step would be to send these signals to the ESP32 chip. This is where we will develop a significant component of the logic to control when the load cells are sampled. Furthermore, the ESP32 script needs to generate an HTTP request wirelessly to our cloud-hosted web application so it can write in the measured weight when certain conditions are met. These include if the weight is stable, if the website hasn’t been updated yet, and so on. Find below some of the logic I wrote for the ESP implementing the above concepts in detail. Some of it is in pseudocode, for simplicity:
void loop()
{
  static float history[4];
  static float ave = 0;
  static bool stable = false;
  static bool webUpdated = false;
  static float weightData = 0.0;

  // When should we send a request to the server? this controls that
  if (stable && !webUpdated)
  {
    // Only try if the wireless network is connected
// WL_CONNECTED is an imported state from the earlier logic in the ESP
    if((wifiMulti.run() == WL_CONNECTED))
    {
      HTTPClient http;

      Serial.print("[HTTP] begin...\n");
      Serial.println(weightData);

      // Write string address of where website is hosted here

      String weight = String(weightData, 1);
      String fullAddress = String(address + weight);
      http.begin(fullAddress);

      Serial.print("[HTTP] GET...\n");

      // start connection and send HTTP header
      int httpCode = http.GET();

      if(httpCode > 0)
      {
        // HTTP header has been send and Server response header has been handled
        Serial.printf("[HTTP] GET... code: %d\n", httpCode);

        // file found at server, response 200
        if(httpCode == HTTP_CODE_OK)
        {
          // clear the stable flag as the data is no longer valid
          stable = false;
          webUpdated = true;
          Serial.println("Web updated");
        }
      }
      else
      {
// debugging case
        Serial.printf("[HTTP] GET... failed, error: %s\n", http.errorToString(httpCode).c_str());
      }

      http.end();
    }
  }

  // Check the weight measurement every 250ms (THIS IS ARBRITRARY)
  if (millis() - scaleTick > 250)
  {
    scaleTick = millis();
    // Read from the HX711. have 2 do this before using data
    LoadCell.update();

    weightData = abs(LoadCell.getData());
    //running average
    history[3] = history[2];
    history[2] = history[1];
    history[1] = history[0];
    history[0] = weightData;
    ave = (history[0] + history[1] + history[2] + history[3])/4;

    // Logic to control when to write in the weight measurement
    if ((abs(ave - weightData) < 0.1) &&
        (ave > 30) &&
        !webUpdated)
    {
      stable = true;
    }

    // IF we've updated the website AND
    //  the average weight is close to zero, clear the website updated flag
    //  so we are ready for the next weight reading
    if (webUpdated && ave < 1)
    {
      webUpdated = false;
    }

    Serial.print("Load_cell output val: ");
    Serial.println(weightData);

    // Write in the scale reading here!
  }
}
The web application handles incoming HTTP requests from here on out, so there is no more to implement on the scale side of things.
Now, this plan that our team developed in theory works very well, but some of the things that concern us mainly have to do with uncertainties on the scale end. Hacking a scale requires a strong understanding of how the scale is built to begin with, so we can avoid damaging existing wiring and components. So I began to think about alternative options for scale integration that wouldn’t involve the internals of the scale electronics. A less risky, but equally stimulating implementation idea would be to hook up an RPI camera and physically read the digital scale reading; this would also require talking to an external sensor which would tell the camera to only “sample” and take pictures when the door of our apparatus is closed. The module would forward the image result to an ML algorithm which would detect the weight measured and write it to the database.
The drawbacks to this approach are the increased probability of measurement inaccuracy, as well as the fact that it would be harder to control the logic for when to capture the images. Also, images are more memory intensive than streams of data, so the RPI would need to have a decent amount of memory onboard to handle the image capturing. In either case, we have plenty of money under the budget to implement both (highly cost effective) ideas, so we will be trying both in parallel and seeing which approach makes more sense.
I envision the next 2 weeks in advance of our demo to be an important time for our project development; I’m excited to get to work on the scale once our parts come in!
Leading into the Spring Break, my main goals were to continue work on our web application while continuing to develop ideas for implementation of the scale integration in our project.
Regarding the web application, we thought it would be appropriate to have a working demonstration of some of its basic features ready by our next weekly meeting with TAs and instructors – planned for Monday, March 11th. Because hosting it on the Amazon Elastic Compute (EC) instance is not a must for this meeting, we will perform this demonstration on a localhost and will focus on site navigation, frontend development, user-user interaction, and view routing in the presentation of our progress to the course staff. This has been a shared effort amongst the entire group; I would now like to share some of my contributions to the web application:
Google Oauth Feature that registers and authenticates users with their Gmail addresses:

Weight-tracking visuals implemented with chart.js (a JavaScript framework for data management and plotting):

This, along with general routing of the pages, constituted some of the things I worked on the past 2 weeks on the web application front. We hope to flush out some of the main features under the context of user-user interaction, such as posting progress, friend networks, following/unfollowing, and chatting with Websockets, in time for the demonstration on Monday.
With the scale integration component of the project arriving soon, I took some time to compare and contrast the numerous market options. I had been hesitant to start ordering parts due to my unfamiliarity with the market options; however, in preparation for the design report, I performed a thorough evaluation of the possible microcontrollers that we could use for this stage of the project:

The market evaluation and design trade studies sections of the report required a thorough evaluation of factors I hadn’t previously considered, such as power consumption, pin layouts, and opportunities to streamline the entire design pipeline through custom SoC options. Favoring simplicity for the MVP, we will proceed with ESP-related options for scale communication, while researching more robust and impressive options in parallel. The benefit of these SoC designs is the potential to integrate camera and scale communication all in a single chip. This would greatly reduce the complexity of the project and alleviate concerns with separate stages of the project working with one another. Still, we consider this a potential stretch goal in the context of a simple yet effective MVP.