Mudit’s Status Report for March 18

This week I worked on the ethics considerations for our project. This included doing the readings, answering the questions and the reflections on how our project can impact public safety, among other ethical considerations. I followed that up by building a mock circuit of the ampere-maxwell experiment with the ordered components on a breadboard. The circuit worked with the SPDT switch and the solenoid we purchased, as shown below.

Circuit On
Circuit Off

My progress is on schedule and in the next 2 weeks, I plan to finalize my experiment design by soldering the components together such that the experiment is ready to be placed in the booth.

Shizhen’s Status Report for March 11

This week I mainly worked on modifying the Faraday’s law experiment and writing the design review report.

Faraday’s Law Experiment

Since the induced voltage in the original Faraday’s law experiment was too small and transient to turn on an LED, I searched for related papers to see how the set-up can be modified, and found one paper that meets our needs.
Using the equations and methods described in the paper, I was able to determine quantitatively the values of the components (e.g. turns of induction coil, radius of the coil). I documented the new design in the design review report in detail and included a 3D model of the experiment.

Design Review Report

In addition to documenting the implementation of the Faraday’s law experiment, I worked on the introduction and design requirements. I also proofread, formatted and finalized the report.

Because writing the design review report took much longer than I expected, I did not have a chance to work on improving the accuracy of the Arduino analog measurements. However, we will allocate time to work on it after the break. Overall, I believe I am on schedule and have caught up according to the previous week’s plan. Next week I plan to verify the calculated quantities for the Faraday’s law experiment by making a mock-up of the design. I will adjust the values as needed so that the induced emf will be large enough to turn on LEDs.

Team Status Report for March 11

Having done the design report and having received the materials for our experiments, the most significant risk right now would be not getting our experiments to work as intended (unreadable/undetectable voltage values in the Faraday experiment, unnoticeable changes to compass in the Ampere-Maxwell Experiment). We intend to make mockups of the two experiments with the materials we have received and test the results of various inputs to ensure our experiments are viable and contribute to our learning objectives for the booth. For contingencies, we already have various fixes lined up for the kinds of issues we expect (using magnets instead of compass if Ampere-Maxwell output is not visible, using capacitors to lengthen duration of voltage spike in Faraday experiment, using amplifiers to increase voltage output in Faraday experiment for more measurable values, etc).

No changes have been made to the existing design of the systems other than the modifications to the Faraday’s law experiment, as were mentioned/shown in the design review report. The schedule remains unchanged as well from what was shown in the report.

As for new tools that we will need to learn, we have determined that we will use the Arduino to read voltage values and send it to a SQLite database, which will be queried by the web application to reflect the induced voltage scores on screen. As a team, we have some experience in using Arduino and SQLite, but we may need to explore more details to ensure we are reading, sending and querying values in the most efficient way possible. We probably also need to learn how to 3D print some custom parts using the 3D printers in TechSpark.

Mudit’s Status Report for March 11

This week I focused mostly on the design review report and ordering equipment for the ampere-maxwell experiment. For the report, I worked on the ampere-maxwell experiment section in the Design trade studies and system implementation section, as well as the Test, Verification and validation section and the Project Management section. For the project management section, it was helpful to create the bill of materials table that helped us to define our expenditure and budget.

Our progress is on schedule as we have received the materials we ordered. In the next week, I will implement the Ampere-Maxwell Experiment with the materials I have received. This will be a mockup of the circuit (actual equipment but not soldered or installed fully for presentation purposes).

Team Status Report for February 25

Risks and Risk Management

This week we confirmed that the Arduino board can transmit voltage data to a local database through USB connection. However, we discovered that the measurements are not as accurate as we expected, especially for signals at higher frequencies. Additionally, Python may not be fast enough to read and write data of high frequency signals in real time. The inaccuracy and latency will cause the animations of the E and B fields to be inaccurate or delayed. To mitigate this risk, we will look for ways to improve the accuracy and latency. If this approach fails, we will resort to using other hardware.

Changes to the existing plan and team work assignments

Because the Faraday’s law experiment that relies on linear motion does not generate enough electromotive force, Shizhen will work on modifying the design, possibly incorporating circular motion instead in the next few days. Aaron struggled with some web implementation this week, but is overall still on track and will work to cover this implementation next week along with the current schedule for next week.

Otherwise there are no changes to our schedule as we are generally on track.  We are also not making any changes to the Ampere’s law experiment as the mockup has confirmed its feasibility. We will proceed in the next week by ordering our circuit components and building the actual experiments afterwards, while testing the Arduino chip with our experiment mockups. As we wait for the circuit components to arrive, we will also work on improving the accuracy of the voltage sensing method, a new task that arose from the recently discovered design challenge.

Progress

As tested by Shizhen, the Arduino chip is able to send serial voltage data via a USB cable into a CSV file with Python. The database that Aaron is implementing for the web app functions on python as well, so integration seems easier. This averts the major risk that we mentioned in our previous report. We will now focus on delivering the CSV data to the web application.


Shizhen’s Status Report for February 25

This week I primarily worked on testing the Faraday’s law experiment and the Arduino MKR 1010 Wi-Fi board.

Faraday’s Law Experiment

Since I do not have a magnet yet, I constructed an electromagnet by winding wire around a thin, long metal rod, which is somewhat ferromagnetic. I then shorted the wire with two 9V batteries connected in series, and the current was measured to be about 2.00 A. I then put an “induction coil” (a spool of wire) through the electromagnet, and connected two ends of the coil to an oscilloscope to measure the induced electromotive force. The set-up is shown in the image below.

When the power supply is turned on or off, an appreciable amount of voltage (~1V) change can be observed, but it decays very quickly, decreasing to almost 0V in less than 5ms. Additionally, moving the induction coil induces a small voltage (~100mV), and it is also quite transient. Some oscilloscope graphs are shown below. Therefore, it appears relying on linear motion cannot generate the required voltage to turn on an LED, which is deemed an important visual aspect of the demonstration.

Induced emf when power is turned on
Induced emf when moving the induction coil

Arduino MKR 1010 Wi-Fi

I tested the Arduino MKR 1010 Wi-Fi to see if the voltage measured by the analog pins can be directly sent to a CSV file or a MySQL database through a USB cable. I discovered the PySerial library can communicate with the Arduino board and wrote a few scripts to test its viability.

I first generated a 100 Hz, 1V peak-to-peak signal with a 1V DC bias with ADALM and used one of the analog pins on the Arduino to sense the signal at 2000 Hz. I then used Python to collect the voltage data and write it into a CSV file. There appear to be ways to write the data to a MySQL database, too. As the waveform below shows, the frequency is more or less correct, but the peak-to-peak voltage is about 1.5V, 0.5V higher than the actual value, and the signal bias appears to be 1.5V, not 1V.

Therefore, this method of sensing voltage is probably acceptable for measuring the polarity of the voltage in the Ampere’s law experiment. However, some calibration is needed to accurately measure the time-varying induced electromotive force in the Faraday’s law experiment, and the actual voltage in the Ampere’s law experiment.

Looking ahead

My progress is a little behind, as the original design for the Faraday’s law experiment needs to be modified, and the Arduino voltage sensor is not as accurate as expected. To catch up, I plan to spend more time next week to tackle these problems as my schedule appears to be more flexible. I will work on improving the accuracy of the Arduino analog pins and the design for the Faraday’s law experiment.

Mudit’s Status Report for February 25

For this week, I worked on parts of the Design review report, factoring in the feedback given from the design review presentation.

I also made a mockup of the Ampere-Maxwell Experiment to ensure that it would work with the actual components we purchase. This mockup experiment was done with readily available materials in TechSpark, using a 9 volt alkaline battery, a 9V to 5V Power Supply converter, a spool of wire, a 1KOhm resistor and a breadboard. A voltmeter was connected across the resistor to ensure that the resistor was consuming most of the voltage rather than the coil of wire (for safety considerations and to ensure the coil of wire can last over long periods or repeated reuses). I used my phone’s compass to check if the deflection was working as expected, since the phone uses its magnetometers to orient the compass as well, similar to an actual compass. The deflection noted was significant, moving the needle from 298 degrees North-west to 160 degrees South. Since the mock up of the experiment is working, I will now purchase the actual parts that will be used to build the actual experiment.

My progress is on schedule as I have designed the mockup of the experiment and tested it to make sure it is working. In the next week, I will put in the order for the materials together with Shizhen’s equipment for the Faraday Experiment so that we can streamline our component/circuit design choices such that our experiments look consistent with another aesthetically, rather than appearing as 2 separately designed parts of the booth. While waiting for the component delivery, I will work with Shizhen to test the delivered Arduino chip with the mockup experiment. The aim will be to ensure the Arduino can detect the voltage polarity of the Ampere Maxwell experiment, and can send this data to a MySQL database or through a wired connection to a laptop.

Team Status Report for February 18

This week, we modified the block diagram slightly, since we identified that both experiments will be gathering voltmeter data that will be sent to our hardware bridge, which will then be accessed by the web app via a MySQL server. Furthermore, we developed schematics of the Faraday’s Experiment and the Ampere-Maxwell Experiment. The wireframe for the web application was also developed, along with some pages of the web application itself, and a 3D model of the booth was made. Our schedules remain unchanged but the Gantt chart was updated to reflect the assignment of each task to a certain individual for more clarity.

Risks and Risk Management

We are still working on confirming the hardware bridge. We have ordered a Wifi-enabled Arduino and plan to use that to take in voltmeter readings and direct that to the MySQL server. We intend to test this once the Arduino is delivered. If the Arduino is unable to send the voltage data to a MySQL server, we will consider alternatives such as using a TCP/IP Voltmeter device which is slightly more costly ($60) but guarantees voltmeter readings being fed into a MySQL database.

Changes to the Existing Design

After discussing with Professor Sullivan about transmitting data read by sensors (e.g. voltmeters) to the database for the web app, we decided for now we can just send the data to a local machine through wired connection, instead of sending the data to the cloud, such as AWS, to simplify the design and focus more on the core of the project. The schedule, however, wouldn’t actually change because we will spent the time allocated for implementing the wireless connection on developing wired connection.

Principles of Engineering, Science, and Math

Idea generation and selection: We came up with a few viable experiments to demonstrate Faraday’s and Ampere’s laws, and we decided on the ones that most align with our goal of making the system instructive yet simplistic, after considering the pros and cons of each option.


Shizhen’s Status Report for February 18

This week I mainly worked on designing the Faraday’s law experiment, and making the design review presentation.

Faraday’s Law Experiment

I decided that a simpler, more straightforward experiment would be more instructive for students than a complex demonstration. Therefore, instead of proceeding with the design of a Faraday disk generator, I opted to design an experiment involving changing the magnetic flux through an induction coil by moving a bar magnet through it (shown below).  I believe the linear motion of the magnet can be more easily understood than the circular motion of a Faraday disk, but nonetheless captures the essence of Faraday’s law. Moreover, by showcasing two induction coils with different number of turns, we can also demonstrate the key concept that the induced electromotive force is directly proportional to the total number of turns. Furthermore, the induced voltage likely can turn on an LED, which can make the experiment more engaging, whereas the voltage generated by a Faraday disk is probably too small to do so.

I then made a block diagram for the design, shown below.

ECE Courses

To develop this design, I relied on my knowledge about analog circuits (18-220) and electromagnetism, especially Faraday’s law (18-300).

3D Model of the Booth

After discussing with Mudit and Aaron about the design of the booth, I used TinkerCAD to create a 3D illustrative model to be used in the design review presentation, shown below. Essentially, there are two transparent cases housing the experiments and circuitry on a table, and there is a touch-screen display in the middle that would show the web app. The user would be able to see how the experiments are constructed, and interact with the experiment by sliding a magnet or flipping a switch, etc.

Overall, I believe I am on schedule. Next week I plan to order the parts needed for the Faraday’s law experiment (induction coil, magnet, etc), and build a demo circuit on a breadboard to determine its viability. I will also discuss with Mudit and Aaron about transmitting measured voltages locally from the sensors to the web app.

Aaron’s Status Report for February 18

This week, I continued working on development of the web application, discussing key design choices with Shizhen and Mudit, and working on the Design Review presentation.

Authentication:  I picked up where I left off last week and finished implementation and authorization of OAuth, and set up the basic frame for users to be authenticated as administrators to access admin web pages.

Admin Capabilities: Adding Educational Modules:

For now, I have designed a few Django models: Module, Content, and Text. Each “Module” corresponds with a certain chapter or topic, for example “Basics of Electrostatics”. Within each “Module”, we can have any number of “Content” blocks, which describe a section of the larger topic (for example, “Gauss’ Law”). Within each “Content”, we can also have any number of “Text” blocks, which would correspond to the actual educational text. All these models are saved and stored within the database, so they are not deleted when the server is reset.

Here is an example of this  in action:

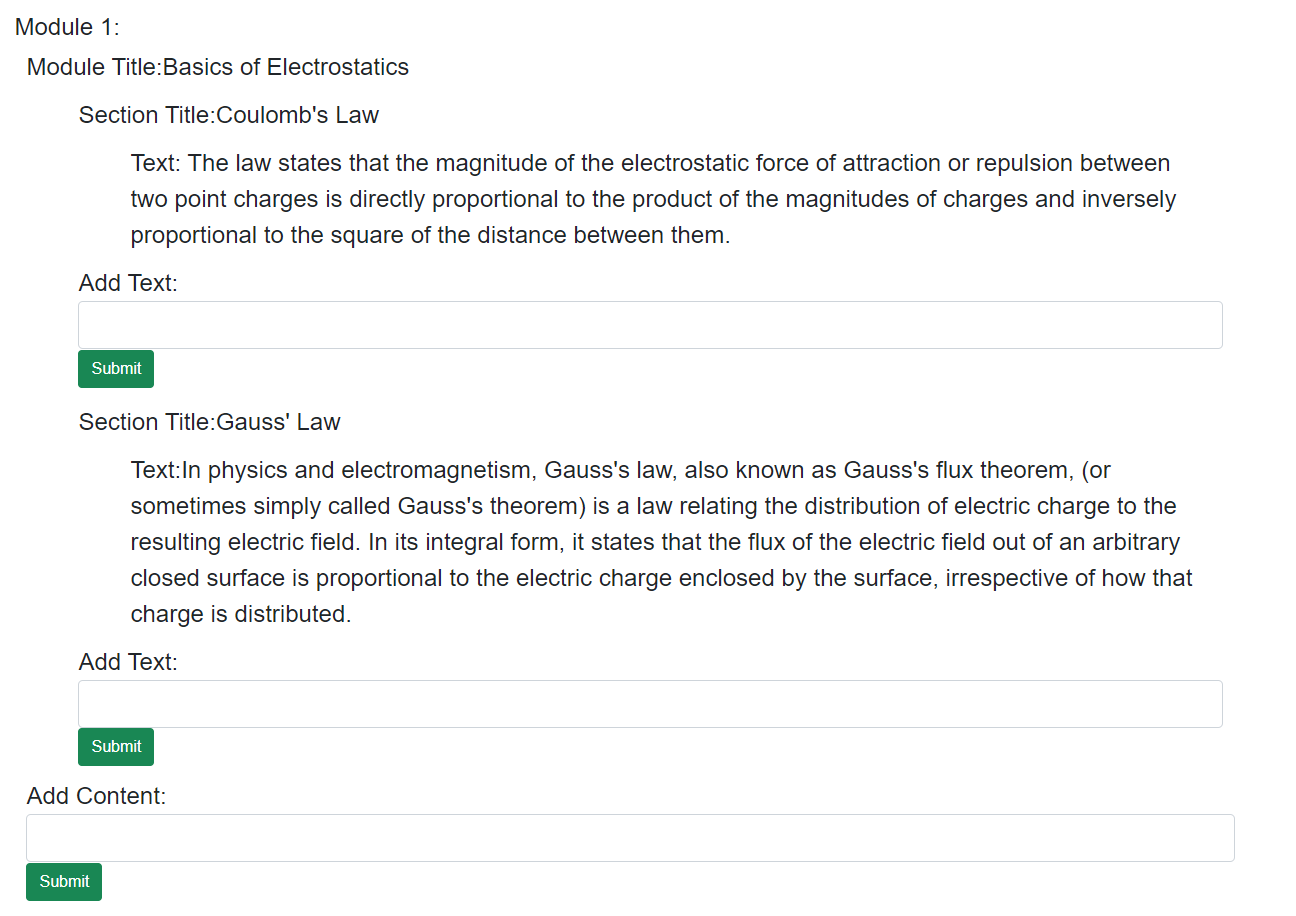
Modularizing the design this way allows increased customization for Admins who are creating educational content using our platform, and can view exactly what the site users will view (similar to this very wordpress page!). Next, I plan on adding increased options, such as adding images, or quiz exercises along the modules. Then, I will improve the front end design and look of the editing page.

Javascript and AJAX:

Additionally, to make adding modules simple and dynamic, the admin page where editing pages is possible updates in real time whenever a change is made using AJAX, so the admin can visually view the page update as they are modifying it without refreshing. The edit_admin HTML page is constructed from live info from the database for easy usage.

I also implemented the user-view, so non admin users will be able to view all the modules, but are not able to change any of the information in them. Individual Modules are also split up so that they each correspond to a different page, to avoid endless scrolling on the user’s end.

Before integration, I want to add more core features to the website to prepare for smooth integration, such as being able to add images to the educational modules, exercises, and the end of module quiz, along with improving the front end design of the website to make it more user accessible.

Overall, I believe I am on schedule. Next week I plan to work with Mudit and Shizhen in discussing integration, and continue to add more features to the web application.

ECE Courses:

17-437 Web Application Development

18-330 Introduction to Computer Security

18-213 Introduction to Computer Systems

18-300 Fundamentals of Electromagnetics