Aaron’s Status Report for April 1

This week, I started working on integration with Shizhen. I learned how to use a Python “csv” package to read data from CSV file, and I combined this with Django and Javascript to call a function automatically every few seconds to read from the CSV file, and display the data on screen. Once the CSV files can be updated in real time with the circuit voltage data from Shizhen’s implementation, the web application is able to read the data, and display it on screen instantly using AJAX. I also made minor front end design changes to prepare for the interim demo, so the web application can look more polished with both the experimental instructions and the educational modules.

Next week, I will prepare for the Interim Demo to have a working, and integrated product with Shizhen and the Faraday experiment. I am mostly on track, and hope to have a functional product for the interim demo.

Mudit’s Status Report for April 1

This week I worked with Shizhen on examining the ADALM as a possible alternative to arduino for the Hardware Bridge section of the project. I found resources for running scripts on Scopy to automate the oscilloscope readings from Scopy. The main issue I was stuck at with Shizhen was figuring out how to get these oscilloscope values transferred into a CSV file that could be read by the web app. There is not much documentation on scripting with the ADALM but we were lucky to find some reference code on the ADALM support page that helped us to solve the issue.

Other than that, I worked on building the updated Gantt Chart for the last 4 weeks of our project. Based on our weekly meeting, I decided to not solder the Ampere-maxwell experiment so that we can make maintenance easier. I will instead be using female to female jumper wires and crocodile clips for the connections instead, and will order those components this week.

In the next week, we will present our interim demo and I will be working on the E&M content for the web app for the highest difficulty level (engineering students with strong mathematical background).

Team Status Report for April 1

Design Changes

Because of the superior instrumentation capabilities of ADALMs compared to Arduinos, we are now focusing on developing the hardware/software connection with an ADALM. The change does not incur any monetary cost, as we have access to ADALM already. However, to accommodate this change we need to learn to interface with ADALMs directly without using the Scopy graphic user interface so that the web application can access the data captured by an ADALM’s oscilloscope.

Risks and Risk Management

At this stage of the project, we have built the three separate systems (the web application and the two experiments) and need to integrate them. Therefore, the most significant risk is failing to come up with a hardware/software bridge. To manage this risk, we have explored two hardware options (ADALM and Arduino) to measure the experimental values in real-time and a few specific methods to interface with the hardware, so there is a high likelihood that one of these methods will work. If we fail to obtain data captured by the ADALM directly, we will use Arduinos as a contingency plan.

Schedule and Gantt Chart

We have made some updates to the schedule for the last few weeks of the project. The updated Gantt Chart is attached below.

Shizhen’s Status Report for April 1

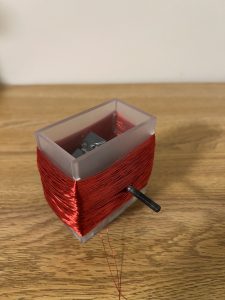
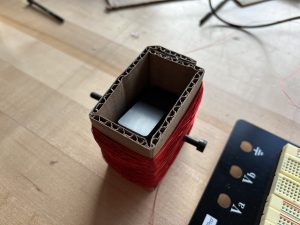
This week I focused on constructing the hardware/software bridge that transmits the real-time quantities of the experiments (e.g. induced voltage of the Faraday’s law experiment) to the web application. Since Arduinos have much worse oscilloscope performance than the portable ADALMs in terms of sampling speed, accuracy, and reliability, and we already have some experience working with them, I decided to look into ways to directly collect readings from an ADALM’s oscilloscope to a csv file so that Aaron can let the web application read the data in the csv file and display it on the web app.

I discovered three main methods to output data collected with an ADALM:

  • Use the scripting ability of Scopy (software for ADALM): We can write scripts in javascript and then use the Debugger Instrument in Scopy to run these scripts.
  • Use libm2k, a C++ library, to write C++ applications that capture and generate data from the host computer.
  • Install Python bindings for libm2k and write Python programs to capture data.

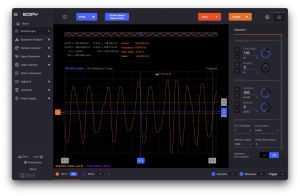
I attempted the first method initially, and was able to have Scopy run automatically and write data to a csv file. However, although Scopy displays the correct oscilloscope plot, the data written to the csv file is always 0. I suspect the issue may have to do with the USB connection via a dongle.

I then tried the third method, but there were not Python bindings for MacOS 13 currently, so I will re-attempt this method with another machine.

The second method posed the most significant learning curve, as I have no experience with C++. After failing to compile an example cpp file, I decided to not spend too much time learning C++ and instead focus on the other two methods first.

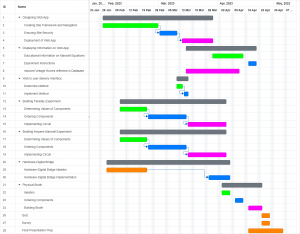
I am behind the schedule by a few days as constructing the hardware/software bridge took much longer than expected. To catch up, I plan to spend more time working on it in the next few days before the interim demo. If a connection using ADALM cannot be set up properly, I will pivot towards using Arduinos, though this option comes with its own shortcomings.

Shizhen’s Status Report for March 25

In addition to participating in the ethics discussion, this week I learned to use the laser cutters in TechSpark and made a nicer, more sturdy frame for the Faraday’s law experiment with 1/8” acrylic (shown below).

I then connected various combinations of LEDs to the two ends of the induction coil. Manually spinning the magnets was able to light up two red LEDs in series, and a blue LED. To test how much voltage the experiment can output, Mudit and I along with another friend connected a drill to the bolt to spin it quickly. Visually the two red LEDs in series became much brighter, and the oscilloscope measured about 16Vpp. A video can be viewed here.

I believe I am on schedule, as I was able to complete the tasks listed in last week’s report. Next week I will integrate the experiments with the web app with Aaron.

Aaron’s Status Report for March 25

This week, I participated in the ethics assignment, and tried think about how my web application could be better updated to match what I learned from the meeting. I believe that adding more modules for various skill levels may be a good solution, so I set up a page where a difficulty level can be selected, and the correct modules and information can be displayed based on the selected difficulty level. I also updated the implementation of Edit Modules to Experiments, so instructional pages on the experiments can now be added, thus completing the functionality of the web application. I also created a page that links to a google form quiz and logs out after the usage session is over. Unfortunately, I discovered a bug with the exercises, but since this is not part of our MVP, I have postponed debugging Exercises, and will instead prioritize integration with Shizhen and prepare for the interim demo to have a mostly MVP functional product. In order to do this, I created a starter js file to add the data scraper from the spreadsheet that will be called every half second, where will update the values in the experiment page with the information received from the experiment. I believe I am on schedule, and next week I will begin integration with Shizhen.

Team Status Report for March 25

As we prepare for the interim demo next week, the plan is to have circuits for the two experiments finalized, and the shell of the web app completed (this would not include the content of the web app, which can be easily added in the week after once the ability to create modules and add images has been finalized for the interim demo).

The most significant risk to our project at this stage would be to not reach the interim demo deadline. We managed this risk by having the demo circuits (on breadboards) already made in case there are issues with soldered circuits. The web app is largely complete with functionality and ready for integration with the circuits.

No changes have been made to the schedule or the design of the system.

Mudit’s Status Report for March 25

This week I participated in the ethics discussion with other groups and we considered the importance of accessibility of our educational content in the web app. Since our audience can range from from pre-university students to Engineers with a mathematical background, we considered implementing modules of different complexity levels to cater to all of our audiences. This would mean more qualitative explanations of EM to pre-university students and a more mathematical treatment of EM for Engineering students. For the Ampere-Maxwell experiment, I started soldering components to create the experiment set-up. One of the solenoids we purchased seems to have lost its wire connections and no longer conducts, so I have replaced that with a smaller solenoid that is working. Once the soldering is done, the components should remain intact easily as they would not be frequently disconnected.

The progress is on schedule and by next weekend I should have the experiment set-up made in time for the interim demo.

Shizhen’s Status Report for March 18

Progress

This week I implemented the Faraday’s law experiment using the components we purchased.
As the figure below shows, I glued two ceramic magnets onto a bolt, and placed the magnets inside an inductor coil wound with magnet wire around a frame made of cardboard. The poles of the magnets are located at the large top and bottom surfaces, so the magnetic flux in the coil changes as the bolt is rotated, inducing an emf. The two ends of the coil are then connected to an oscilloscope and a red LED, which is used as a visual indicator of the strength of the induced emf.

The plot below shows the time-varying induced electromotive force. Note that each vertical division represents 500 mV, so the peak voltage induced is about 2V, which is higher than the turn on voltage of a red LED, and it indeed lit up.

I believe I am still on schedule, as I completed the tasks outlined in last week’s report.

Plan for next week

I think it will be interesting to connect another LED that is in the opposite direction as the first one to the coil to see if they alternate lighting up (which should be the case) next week. Additionally, I will try to learn to use the laser cutters in TechSpark and cut a nicer frame for the experiment after I polish the design.


Team Status Report for March 18

Currently, our most significant risk would be the integration of the induced voltage measurements into our database. In the upcoming weeks, we will be working on getting the Arduino data into our web application under the specified latency limit. We have tested the Arduino sample gathering timing, which appears to be under 1 ms per sample. The remaining part of the latency would be to send the data to a SQLite database and have our web app gather that data from the database itself.

As of now, no changes have been made to our existing design of the system and the schedule remains intact. In the following 2 weeks, we will finalize our experiments by soldering them such that they are ready to be presented in the booth. By then, the web app framework will also be prepared such that we can start adding content to it in the following weeks.