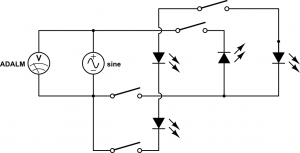
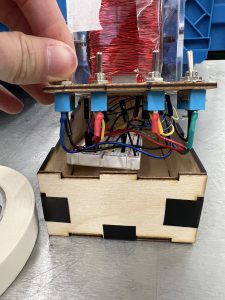
This week I made some modifications to the case of the Faraday’s law experiment. Specifically I increased the height of the base to accommodate the wires that connect the switches and the LEDs. I also made the length of the base shorter to save some material, since I decided to replace the full-size breadboard with the half-size breadboard. I then laser cut the case and wired up the switches and the LEDs to the emf generator according to the wiring diagram and the circuit schematic below.
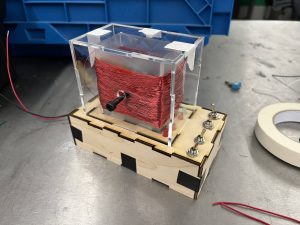
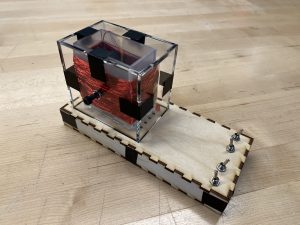
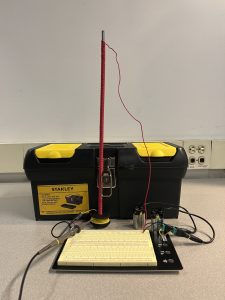
The completed experiment set-up is shown below. Different combinations of LEDs will light are when the magnets are spun, according to the states of the switches.
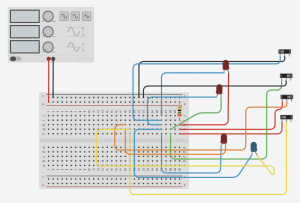
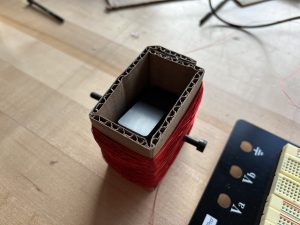
Wiring in the base
I also worked with Mudit to create a laser-cut design for the case of the Ampere’s law experiment, which will be fabricated in the next few days, if not this weekend. Finally, I worked with Aaron and Mudit to make sure the web application can support measuring with two oscilloscope channels and displaying the plots.
Overall I am on schedule. In the last week leading up to the final demo, I will touch up the experiment set-ups to make them look better. I will also work on the educational content, in addition to the final report and video.
This week I worked on the final presentation and the content of the modules, made the cases for the two experiments, and along with Mudit and Aaron, integrated the Ampere’s law experiment with the web application. For the final presentation, I updated the block diagrams and contributed to the verification and validation sections. I also edited the content of the intermediate level module and added 8 questions to the quiz.
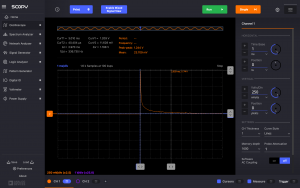
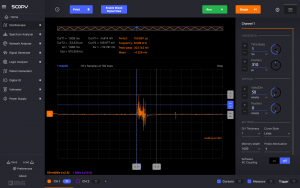
Similar to the integration of the Faraday’s law experiment with the web app, we used ADALM and libm2k to transmit the measured voltage across the solenoid in the Ampere’s law experiment to the web app. Initially we were perplexed because we were only able to observe the transient response of the circuit — the voltage rises when the direction of current is switched, and quickly drops to 0. After realizing that AC coupling was selected on the BNC adapter for the oscilloscope (which is why the DC component was not present), we were able to display the desired plot on the web app.
To fabricate the cases for the experiments, I first came up with a few designs and shared with my teammates to get their feedback. The main design tradeoffs that I considered were whether to enclose the LEDs in the Faraday’s law experiment, and whether to show the breadboard used to make electrical connections. Ultimately, we decided that the LEDs should be enclosed so that users cannot remove them; and that the breadboard should be hidden to avoid confusing people who do not know the internal workings of a breadboard. After sketching the case on paper, I made a 3D drawing of it in TinkerCAD. Then I used CoralDraw to generate the drawing to be laser cut. Initially, the kerf setting for the parts was a little off, so the boxes fit too tightly, but overall the case satisfies our needs.
Faraday’s law experiment with case
I believe I am on track. This weekend I will try to find the optimal kerf value through trial and error, and finalize the case for the Faraday’s law experiment. Next week, I plan to make the case for the Ampere’s law experiment, and work on the educational content.
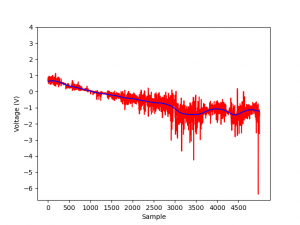
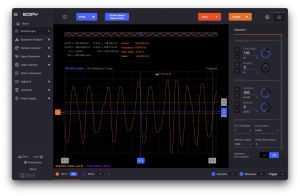
This week I primarily worked on the integration of the Faraday’s law experiment and the web application. Because last week I was not able to install libm2k (a C++ library that interfaces with ADALM) and its Python bindings on my Mac laptop, I worked with Aaron to see if his Windows computer would support the library. I shared with him my findings, and we were able to successfully install libm2k and control an ADALM’s oscilloscopes directly with a Python script. We realized that the noise was significant in the data, so I employed the Butterworth digital lowpass from SciPy to filter out the noise. The original (red) and filtered signal (blue) are displayed below.
I also worked with Aaron to display the oscilloscope plots on the web app in real time, where we faced some challenges related to the smoothness of the animation, and we will continue to work on it next week. If this problem persists, we will look into other ways to display the oscilloscope plots, such as using Scopy.
I also started designing the final version of the Faraday’s experiment, and will purchase and laser cut a few more parts, and fabricate the system next week. Overall, I believe I am on schedule, as last week’s challenge with using libm2k was solved.
Testing and Validation
The following is a list of tests that I have or will run along with the analyses for the results.
Used a power drill to spin the magnets in the Faraday’s law experiment at a very high rate and induced a peak-to-peak voltage of about 16V to see if the LEDs would blow out. Observed that the LEDs used continued to function normally, so in regular use-cases the LEDs should not pose any danger to the user.
Inspect the final experiments to ensure there are no sharp edges, corners that can be dangerous.
Use the experiment under different scenarios (applying varying forces, performing unintended behaviors, etc) and repeatedly to ensure it’s robust.
Proofread the content of the educational modules and let other people with different levels of experience in physics to use the modules to test the modules’ effectiveness and clearness.
Measure the delay between action performed in the experiment and the response of the web application to see if the delay is within the limit we set forth.
Measure the induced AC voltage with Scopy and compare the result with our measured results to see if the measurements are accurate.
This week I focused on constructing the hardware/software bridge that transmits the real-time quantities of the experiments (e.g. induced voltage of the Faraday’s law experiment) to the web application. Since Arduinos have much worse oscilloscope performance than the portable ADALMs in terms of sampling speed, accuracy, and reliability, and we already have some experience working with them, I decided to look into ways to directly collect readings from an ADALM’s oscilloscope to a csv file so that Aaron can let the web application read the data in the csv file and display it on the web app.
I discovered three main methods to output data collected with an ADALM:
Use libm2k, a C++ library, to write C++ applications that capture and generate data from the host computer.
Install Python bindings for libm2k and write Python programs to capture data.
I attempted the first method initially, and was able to have Scopy run automatically and write data to a csv file. However, although Scopy displays the correct oscilloscope plot, the data written to the csv file is always 0. I suspect the issue may have to do with the USB connection via a dongle.
I then tried the third method, but there were not Python bindings for MacOS 13 currently, so I will re-attempt this method with another machine.
The second method posed the most significant learning curve, as I have no experience with C++. After failing to compile an example cpp file, I decided to not spend too much time learning C++ and instead focus on the other two methods first.
I am behind the schedule by a few days as constructing the hardware/software bridge took much longer than expected. To catch up, I plan to spend more time working on it in the next few days before the interim demo. If a connection using ADALM cannot be set up properly, I will pivot towards using Arduinos, though this option comes with its own shortcomings.
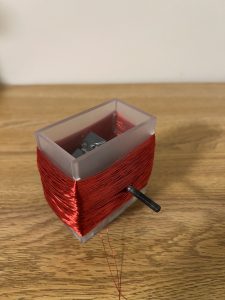
In addition to participating in the ethics discussion, this week I learned to use the laser cutters in TechSpark and made a nicer, more sturdy frame for the Faraday’s law experiment with 1/8” acrylic (shown below).
I then connected various combinations of LEDs to the two ends of the induction coil. Manually spinning the magnets was able to light up two red LEDs in series, and a blue LED. To test how much voltage the experiment can output, Mudit and I along with another friend connected a drill to the bolt to spin it quickly. Visually the two red LEDs in series became much brighter, and the oscilloscope measured about 16Vpp. A video can be viewed here.
I believe I am on schedule, as I was able to complete the tasks listed in last week’s report. Next week I will integrate the experiments with the web app with Aaron.
This week I implemented the Faraday’s law experiment using the components we purchased.
As the figure below shows, I glued two ceramic magnets onto a bolt, and placed the magnets inside an inductor coil wound with magnet wire around a frame made of cardboard. The poles of the magnets are located at the large top and bottom surfaces, so the magnetic flux in the coil changes as the bolt is rotated, inducing an emf. The two ends of the coil are then connected to an oscilloscope and a red LED, which is used as a visual indicator of the strength of the induced emf.
The plot below shows the time-varying induced electromotive force. Note that each vertical division represents 500 mV, so the peak voltage induced is about 2V, which is higher than the turn on voltage of a red LED, and it indeed lit up.
I believe I am still on schedule, as I completed the tasks outlined in last week’s report.
Plan for next week
I think it will be interesting to connect another LED that is in the opposite direction as the first one to the coil to see if they alternate lighting up (which should be the case) next week. Additionally, I will try to learn to use the laser cutters in TechSpark and cut a nicer frame for the experiment after I polish the design.
This week I mainly worked on modifying the Faraday’s law experiment and writing the design review report.
Faraday’s Law Experiment
Since the induced voltage in the original Faraday’s law experiment was too small and transient to turn on an LED, I searched for related papers to see how the set-up can be modified, and found one paper that meets our needs.
Using the equations and methods described in the paper, I was able to determine quantitatively the values of the components (e.g. turns of induction coil, radius of the coil). I documented the new design in the design review report in detail and included a 3D model of the experiment.
Design Review Report
In addition to documenting the implementation of the Faraday’s law experiment, I worked on the introduction and design requirements. I also proofread, formatted and finalized the report.
Because writing the design review report took much longer than I expected, I did not have a chance to work on improving the accuracy of the Arduino analog measurements. However, we will allocate time to work on it after the break. Overall, I believe I am on schedule and have caught up according to the previous week’s plan. Next week I plan to verify the calculated quantities for the Faraday’s law experiment by making a mock-up of the design. I will adjust the values as needed so that the induced emf will be large enough to turn on LEDs.
This week I primarily worked on testing the Faraday’s law experiment and the Arduino MKR 1010 Wi-Fi board.
Faraday’s Law Experiment
Since I do not have a magnet yet, I constructed an electromagnet by winding wire around a thin, long metal rod, which is somewhat ferromagnetic. I then shorted the wire with two 9V batteries connected in series, and the current was measured to be about 2.00 A. I then put an “induction coil” (a spool of wire) through the electromagnet, and connected two ends of the coil to an oscilloscope to measure the induced electromotive force. The set-up is shown in the image below.
When the power supply is turned on or off, an appreciable amount of voltage (~1V) change can be observed, but it decays very quickly, decreasing to almost 0V in less than 5ms. Additionally, moving the induction coil induces a small voltage (~100mV), and it is also quite transient. Some oscilloscope graphs are shown below. Therefore, it appears relying on linear motion cannot generate the required voltage to turn on an LED, which is deemed an important visual aspect of the demonstration.
Induced emf when power is turned onInduced emf when moving the induction coil
Arduino MKR 1010 Wi-Fi
I tested the Arduino MKR 1010 Wi-Fi to see if the voltage measured by the analog pins can be directly sent to a CSV file or a MySQL database through a USB cable. I discovered the PySerial library can communicate with the Arduino board and wrote a few scripts to test its viability.
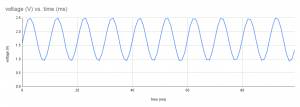
I first generated a 100 Hz, 1V peak-to-peak signal with a 1V DC bias with ADALM and used one of the analog pins on the Arduino to sense the signal at 2000 Hz. I then used Python to collect the voltage data and write it into a CSV file. There appear to be ways to write the data to a MySQL database, too. As the waveform below shows, the frequency is more or less correct, but the peak-to-peak voltage is about 1.5V, 0.5V higher than the actual value, and the signal bias appears to be 1.5V, not 1V.
Therefore, this method of sensing voltage is probably acceptable for measuring the polarity of the voltage in the Ampere’s law experiment. However, some calibration is needed to accurately measure the time-varying induced electromotive force in the Faraday’s law experiment, and the actual voltage in the Ampere’s law experiment.
Looking ahead
My progress is a little behind, as the original design for the Faraday’s law experiment needs to be modified, and the Arduino voltage sensor is not as accurate as expected. To catch up, I plan to spend more time next week to tackle these problems as my schedule appears to be more flexible. I will work on improving the accuracy of the Arduino analog pins and the design for the Faraday’s law experiment.
This week I mainly worked on designing the Faraday’s law experiment, and making the design review presentation.
Faraday’s Law Experiment
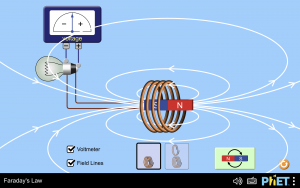
I decided that a simpler, more straightforward experiment would be more instructive for students than a complex demonstration. Therefore, instead of proceeding with the design of a Faraday disk generator, I opted to design an experiment involving changing the magnetic flux through an induction coil by moving a bar magnet through it (shown below). I believe the linear motion of the magnet can be more easily understood than the circular motion of a Faraday disk, but nonetheless captures the essence of Faraday’s law. Moreover, by showcasing two induction coils with different number of turns, we can also demonstrate the key concept that the induced electromotive force is directly proportional to the total number of turns. Furthermore, the induced voltage likely can turn on an LED, which can make the experiment more engaging, whereas the voltage generated by a Faraday disk is probably too small to do so.
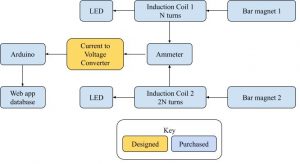
I then made a block diagram for the design, shown below.
ECE Courses
To develop this design, I relied on my knowledge about analog circuits (18-220) and electromagnetism, especially Faraday’s law (18-300).
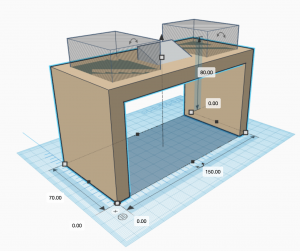
3D Model of the Booth
After discussing with Mudit and Aaron about the design of the booth, I used TinkerCAD to create a 3D illustrative model to be used in the design review presentation, shown below. Essentially, there are two transparent cases housing the experiments and circuitry on a table, and there is a touch-screen display in the middle that would show the web app. The user would be able to see how the experiments are constructed, and interact with the experiment by sliding a magnet or flipping a switch, etc.
Overall, I believe I am on schedule. Next week I plan to order the parts needed for the Faraday’s law experiment (induction coil, magnet, etc), and build a demo circuit on a breadboard to determine its viability. I will also discuss with Mudit and Aaron about transmitting measured voltages locally from the sensors to the web app.
At the beginning of the week, I mainly worked on finalizing the project proposal slides, and practicing the presentation. Overall, I was satisfied with my presentation, as it was interactive, logical and cohesive. However, to improve my presentation skills in the future, I should be calmer and speak more slowly to be more clear and articulate.
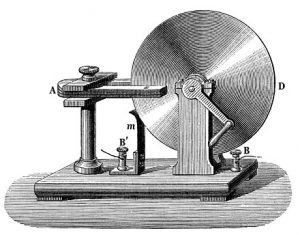
After giving the presentation, I reviewed the relevant electromagnetism concepts, such as Faraday’s law and the Lorentz force law, and started thinking about what specific experiment we can implement to demonstrate Faraday’s law clearly. I came to the conclusion that creating a homopolar generator (or Faraday’s disc) may be a feasible option because:
1. the device should not be too complicated to build, but shows the principles of Faraday’s law well;
2. it is the the first electromagnetic generator, and including a section about its history may draw the attention of students who are more humanities-inclined.
However, it may be a little difficult to explain to students how the magnetic field varies and induces an electromotive force since the motion is circular, not linear.
A Faraday disk generator Source: Émile Alglave, Public domain, via Wikimedia Commons
Lastly, I tinkered with the WordPress website, and customized it such that it meets all the requirements and everyone is pleased with the design. My progress appears to be on schedule.
Next week, I hope to develop the hardware design for the Faraday’s disc and create a bill of materials, in preparation for the Design Review in two weeks’ time.