This week, we focused on presenting the performance of our robot in our final presentations and getting our final documentation ready. For unit testing we carried out the following for all our subsystems.
Unit Testing
For unit testing, we observed some values locally on the Arduino Serial Monitor. A lot of our testing was done in an arena-like setup (described in our overall setup), watching the different states of the robot and adjusting the findings shown below.
(1) Motion control: When deciding the functions for motion control, we were careful to design functions that separated the random exploration from the scent localization. By printing out distances and observing angles, distances reached, and hard stops (where the robot overshoots or undershoots the target and self-corrects itself), we were able to test the basic motion and translation ability of the robot. This involved a lot of tuning for our robot’s weight, wheel speed, and surfaces the robot can drive on comfortably. For the ultrasonic sensors, a similar test for tuning the position and height of the ultrasonic sensors, along with testing in an arena with unscented obstacles was the way we tested for obstacle avoidance.
Findings: We added two additional ultrasonic sensors, and glued our DC motors to the car chassis in order to get stable and reliable movement from the robot.
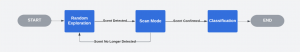
(2) Alerting: Since our robot has clearly defined states, the code separates the messages displayed and LED color patterns for each state. Putting the robot in transition from scan mode, random exploration, obstacle avoidance and classification as shown in the figure below is how we tested for the same.
Findings: For a high-speed control loop like ScentBot’s, we took the decision to host the entire system locally, and the only communication is to the output devices of the LCD and LED display. We explored cloud computing, UART, Wi-Fi, and Master-Slave byte transfer before integrating these, highlighted in our earlier status reports.
(3) Sensing and Scent Localization: The sensors were integrated with our LED display, and this helped us determine the samples we are getting at any point in the robot’s traversal. The scan angles and samples taken can be seen on the LCD display. We tested for whether the robot translated to the correct scan angle, and tested in scenarios where an obstacle was in the way while scanning and while translating to the maximum scan angle so that the robot does not run into the object. Observing the falling and rising values, we also estimated whether the robot was entering and exiting in the case of false positives. There was additional tuning performed for our thresholding for multiple sensors to detect and confirm the scent in our testing.
Findings: We learned that certain channels can classify our scents better, and work with higher/lower thresholds. Namely, the TVOC channel on the ENS160 and the ethanol channel on the Grove sensors. We also increased our scan time from 3s to 5s, to allow for more samples to be collected and prevent the robot from having to perform repeated scans and be more confident in its scent localization.
(4) Classification: Our SVC model was tested on a train-test split of data collected over 2 days in varying temperature conditions over ambient, paint thinner and alcohol scents. This was conducted locally using a Colab notebook before integrating the model onto the Arduino Mega. Moreover, the ability to recognize and confirm the scent while the robot is moving was conducted in our overall test.
Findings: We tuned the SVC model from a polynomial model to a linear model to account for the limited space on the Arduino. The linear model also performed better in our unit tests with live sensor readings. We also explored with using normalization and added statistics for each of our sensor readings like RMS, Mean, Standard Deviation, Maximum and Minimum values.
Overall Testing
Initially, we conducted 24 tests with alcohol and paint thinner scents by randomly placing the object and robot in different positions. We received feedback from our professor on the number of trials and statistics we had reported, hence we went back and conducted more testing according to a concrete plan described below.
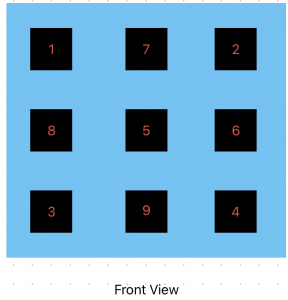
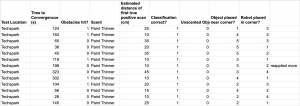
Our overall testing plan is shown in the figure below. We placed the object at one of 9 grid positions, and tested the robot convergence time from corners (1,2,3,4) of the map. We made sure that the object would be at least 1m away from the robot in our testing. The object would be a paint thinner or alcohol scent on a cotton ball. This gives us 32 configurations for each scent to test. We currently have over 35 trials with our paint thinner scent and aim to complete testing in this manner with alcohol this weekend. An example of our test metrics being collected is shown below as well.