Sojeong’s Status Update for 4/25/2020

This week I worked on adding new features to the SVM to further increase its accuracy. I tried adding the variance of the angles and magnitudes. Because the variance indicates how spread out the data is, I thought it would be helpful in characterizing the falls as the magnitudes and angles will deviate a lot more from their mean for falls than non-fall activities. Adding variance as a new feature did not change the number of false negatives, but it reduced the number of false positives. I also wrote a program that randomly chooses a test data and returns the number of false positives and false negatives with the model that is trained without the test data. I tried running the program with different combinations of features to find the optimal features.

In addition to this, I worked on the final presentation slides, and prepared for the presentation as I will be presenting next week.

Sojeong’s Status Update for 04/18/2020

This week I worked on refactoring the SVM code for integration with the Raspberry Pi. Previously, the graphical interface for the demo was not separated from the training and prediction portion of the code. I created a separate class for the SVM model and trained the model in the init function. I also moved the prediction to a separate function in the class so that the model only has to be trained once when it is initialized. Max ran the code on the Pi and it did not have any performance problems, so I did not have to make any adjustments to the size of the feature array. I also collected more data for non-fall activities, because I realized that most of the data that we have is for different types of falls.

Next week is the last week before the final presentation, so I will work on final improvements to the SVM. The integration with the pi seems to be working well, and it will not be that hard to import the modified code on the pi, so I will try adding one or more new features to the SVM and make final accuracy calculations.

Sojeong’s Status Update for 4/11/2020

This week, I worked on calculating the accuracy of the fall detection algorithm for different combinations of features. These values will help us choose the best feature combination to use, and we will also include these in our final paper to compare different features that we tried. To calculate the accuracy, I used one csv file from our data set and trained the SVM with the remaining files, and repeated this for all the files. The accuracy is calculated by dividing the number of true positives and true negatives by the total number of trials. Below is a table of the accuracy for each feature combination.

magnitude, change in angle (x, y, z)

85.976

magnitude, change in z-angle

96.895

magnitude

93.651

change in z-angle

23.034

Although the accuracy of the algorithm with magnitude and change in z-angle as features is high, there were number of false negatives, so I will look into adding new features that could reduce this number. I will also continue the integration with the RPi next week.

In terms of schedule, we are on time.

Sojeong’s Status Report for 4/4/2020

This week I worked on adding new features and developing a visual interface for the fall detection. For the new features, instead of using the raw phase values, I tried using changes in phase. This way, the orientation of the device does not affect the phase values. After combining the change in phase with the magnitude, the algorithm now accurately categorizes jumping and running activities as non-falls. Also, I combined Jacob’s frequency features and tested the algorithm, but the frequency features did not improve the accuracy of the algorithm. Jacob will work on changing the frequency features so that they improve the accuracy of the algorithm.

The visual interface is implemented for the demo next week. Because we currently do not have our components integrated, I thought that it would be useful to visualize the fall detection to make it easier to demonstrate that the algorithm works. When the program runs, it shows the graph of the input acceleration data, and a rectangle with a size of our sliding window moves through the graph and displays the algorithm’s prediction for each window.

I also collected some fall and non-fall data to compare them with the dummy data that Jacob is collecting. From previous data collection, I held my phone on my hand but this time I placed my phone in my pocket to include noises and  possible orientation changes of the device in the pocket.

Next week, I will send the SVM program to Max and we will try integrating the fall detection and raspberry pi components. We will have to check how long it takes for the algorithm to run on the pi and improve the running time if it takes too long. If the algorithm takes too long to run, I will try reducing the feature size. Currently, the size of the feature array for each sliding window is 20: 10 for magnitudes and 10 for phase changes. If I only use the maximum values of each features, I can reduce the size to 2 per window, which will decrease the run time for a large train data.

Sojeong’s Status Report for 3/28/2020

This week I worked on combining the magnitudes and angles of the accelerations as input features to the SVM. At first, I tried inputting them as tuples, but the SVM did not support inputs with dimensions greater than two. Instead of using them as tuples, I appended the angle values after the magnitudes. Now that I have three different combinations of input features (magnitudes, angles, magnitude & angles), I compared the accuracy of each of the features. I randomly chose a test data, then trained the model with the remaining data and counted the number of false positives and false negatives. When the angles were used, there were no false negatives but false positive rate was high and detected all normal activities as falls. This was unexpected because the graphs of the angles showed large differences between the falls and non-falls. However, because using magnitudes as the only feature still provides accurate results, the low accuracy of angle features is not a big problem.

Next week, I am planning to add a visual component to the fall detection algorithm so that it is easier to demonstrate that the algorithm works. I will write a program that graphs the inputs and shows when a fall is detected. I will also get dummy data from Jacob next week and make sure that the algorithm works accurately with his data.

Sojeong’s Status Report for 3/21/2020

This week we discussed about our adjustments to the project as we all are required to work remotely because of the COVID-19 situation. Although the fall detection algorithm can be developed as planned, integration with the hardware component will be hard. To account for this situation, we decided to develop each component of the project separately. My goal is to develop a fall detection algorithm using SVM, but it will not be real time as planned before. Instead of using real time data from the RPi device as the input, I would have to use pre-collected data stream to simulate the real time inputs. A possible solution would be to set up a client-server connection using Python’s socket library, and make the client send data to the server at the same time interval as the collected data. The server can then run the classifier to detect falls. For demonstration, graphing the data stream and notifying when a fall is detected could show that the algorithm correctly detects falls.

My work is currently behind schedule because of the change of plans for the project. Next week, I will continue collecting data for the SVM using my phone. It would be best to collect data with our RPi device, but since the IMU sensors on RPi will provide more accurate data, I predict that the classifier will work as expected on the RPi if it works with the data collected from my phone. I will also have to come up with different ways to use phase data for classification as there was a concern about it being different depending on the orientation of the device. In addition to that, I will have to figure out how to use data stream as an input to the SVM, as the current version only supports importing data from csv files.

Sojeong’s Status Update for 3/7/2020

This week, I realized that using the phase of the accelerations as a feature can be problematic because it depends on the orientation of the device in the pocket. I was using the angle between the xy-plane and z-axis, but the axes could change if the user puts the device in different orientation. It could also lead to inaccuracy if the orientation of the device changes when the user moves. To handle this problem, I decided to use the change in phase over time instead of using the actual values of the phase.

Also, I added the magnitude and phase calculation to the code instead of doing it manually on excel for feature extraction. This was done to prepare for the  integration with the RPi, as we would not be able to move the data received from the RPi to excel and do calculations there.

In terms of schedule, we are still on track.

After spring break, I will continue collecting more data and I hope to start getting data from the RPi and integrate them together.

Sojeong’s Status Update for 2/29/2020

This week I tried using the angles of the acceleration as new features to the SVM. I decided to use the angle between the xy-plane and the z-axis because that would be the angle that changes the most when a person falls. However, I should think more about which axis to use after collecting some data from our device as the orientation of the accelerometer in our device and the phone would be different. I should also consider that the device will be placed inside a pocket, which can also change the orientation.

The angle was defined as: atan(az/(ax^2+ay^2)^0.5) The graph below shows that the angle fluctuates a lot for a fall, while it stays mostly constant for walking.

forward fall
walking

In terms of schedule, we are on track. For next week, I would really need to start collecting and using the data from our actual device as the RPi will be ready to use. All the data that I collected this week and last week were all done in the same position, but I should also try collecting them from different positions and see if they make any difference.

Sojeong’s Status Update for 02/22/2020

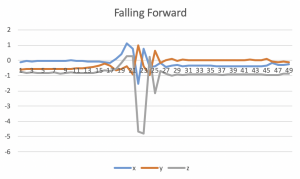
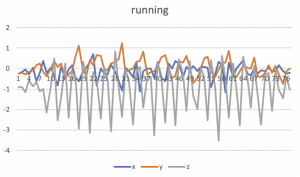
This week, I collected accelerometer data and started working on the fall detection algorithm. Before we get our pi set up, I will use my iPhone to collect the data. When collecting the data, I put my phone in the pocket as our final device will also be used that way. I collected the 3-axis accelerations of me falling forward, backward, sideways, and walking, jumping, running, sitting down, and bending down.

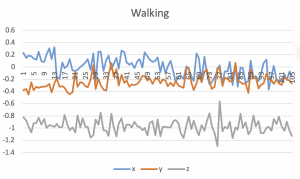
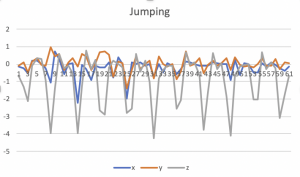
For feature selection, I first tried using the vector magnitude of the three accelerations. Using the magnitude instead of using a list of three accelerations simplifies the algorithm, and I expect that it would give similar results because the graphs of xyz accelerations do not differ a lot from each other as shown in the below graphs.

I calculated the magnitude of the acceleration data ((x^2 + y^2 + z^2)^0.5) and split up the data series into a window of size 10. I chose 10 because it covered the peaks in the fall data. However, this could differ from person to person, so I will have to collect more data to make sure that this interval works.  I trained the svm using forward fall, side fall, and walking data, and tried testing it. The algorithm detects the all kinds of falls, and classifies sitting and bending as non-falls, but it classifies jumping and running as falls.

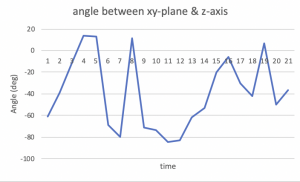
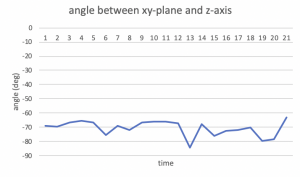
For the next week, I will collect more training data from my teammates to compare how the acceleration data differ among people. To improve the accuracy of the algorithm, getting more data for the train set might help. I will also try using the magnitude and angle of the accelerations as a feature. For running and jumping, the magnitude of the acceleration may be similar with the falls but the angle will definitely be different, so it is possible that the algorithm will be able to classify them properly.

Sojeong’s Status Update for 02/15/2020

This week, I spent time reading existing research papers about different fall detection algorithms. The main points that I was looking for in those papers were what kinds of data they collected to train their algorithm and how they tested it. One of the papers only used accelerations in three axes to train their algorithm, and got 99.14% accuracy for their best results. This was surprising because I thought we would need more than just accelerations to build an accurate algorithm. Seeing the results, we decided to start our project by collecting acceleration data first, and if the results are not satisfying enough, we will combine other data such as angular velocity. For testing, I came up with different types of activities for fall and non-fall categories to clearly define what falls are and to narrow down the types of activities that the algorithm is going to detect. For the next week, we will get the accelerometer and Raspberry Pi, so I am planning to get some data and start writing the fall detection algorithm using SVM. Because the accelerometer data might not be accurate and include some noises, I would also have to think about some ways to preprocess the data.