Team_E7_Report
Team_E7_Slides
Nick Lee, Sojeong Lee, Max Lutwak, Jacob Hoffman
Team_E7_Report
Team_E7_Slides
This week I worked on adding new features to the SVM to further increase its accuracy. I tried adding the variance of the angles and magnitudes. Because the variance indicates how spread out the data is, I thought it would be helpful in characterizing the falls as the magnitudes and angles will deviate a lot more from their mean for falls than non-fall activities. Adding variance as a new feature did not change the number of false negatives, but it reduced the number of false positives. I also wrote a program that randomly chooses a test data and returns the number of false positives and false negatives with the model that is trained without the test data. I tried running the program with different combinations of features to find the optimal features.
In addition to this, I worked on the final presentation slides, and prepared for the presentation as I will be presenting next week.
This week I worked on refactoring the SVM code for integration with the Raspberry Pi. Previously, the graphical interface for the demo was not separated from the training and prediction portion of the code. I created a separate class for the SVM model and trained the model in the init function. I also moved the prediction to a separate function in the class so that the model only has to be trained once when it is initialized. Max ran the code on the Pi and it did not have any performance problems, so I did not have to make any adjustments to the size of the feature array. I also collected more data for non-fall activities, because I realized that most of the data that we have is for different types of falls.
Next week is the last week before the final presentation, so I will work on final improvements to the SVM. The integration with the pi seems to be working well, and it will not be that hard to import the modified code on the pi, so I will try adding one or more new features to the SVM and make final accuracy calculations.
This week, I worked on calculating the accuracy of the fall detection algorithm for different combinations of features. These values will help us choose the best feature combination to use, and we will also include these in our final paper to compare different features that we tried. To calculate the accuracy, I used one csv file from our data set and trained the SVM with the remaining files, and repeated this for all the files. The accuracy is calculated by dividing the number of true positives and true negatives by the total number of trials. Below is a table of the accuracy for each feature combination.
|
magnitude, change in angle (x, y, z) |
85.976 |
|
magnitude, change in z-angle |
96.895 |
|
magnitude |
93.651 |
|
change in z-angle |
23.034 |
Although the accuracy of the algorithm with magnitude and change in z-angle as features is high, there were number of false negatives, so I will look into adding new features that could reduce this number. I will also continue the integration with the RPi next week.
In terms of schedule, we are on time.
This week I worked on adding new features and developing a visual interface for the fall detection. For the new features, instead of using the raw phase values, I tried using changes in phase. This way, the orientation of the device does not affect the phase values. After combining the change in phase with the magnitude, the algorithm now accurately categorizes jumping and running activities as non-falls. Also, I combined Jacob’s frequency features and tested the algorithm, but the frequency features did not improve the accuracy of the algorithm. Jacob will work on changing the frequency features so that they improve the accuracy of the algorithm.
The visual interface is implemented for the demo next week. Because we currently do not have our components integrated, I thought that it would be useful to visualize the fall detection to make it easier to demonstrate that the algorithm works. When the program runs, it shows the graph of the input acceleration data, and a rectangle with a size of our sliding window moves through the graph and displays the algorithm’s prediction for each window.
I also collected some fall and non-fall data to compare them with the dummy data that Jacob is collecting. From previous data collection, I held my phone on my hand but this time I placed my phone in my pocket to include noises and possible orientation changes of the device in the pocket.
Next week, I will send the SVM program to Max and we will try integrating the fall detection and raspberry pi components. We will have to check how long it takes for the algorithm to run on the pi and improve the running time if it takes too long. If the algorithm takes too long to run, I will try reducing the feature size. Currently, the size of the feature array for each sliding window is 20: 10 for magnitudes and 10 for phase changes. If I only use the maximum values of each features, I can reduce the size to 2 per window, which will decrease the run time for a large train data.
This week I worked on combining the magnitudes and angles of the accelerations as input features to the SVM. At first, I tried inputting them as tuples, but the SVM did not support inputs with dimensions greater than two. Instead of using them as tuples, I appended the angle values after the magnitudes. Now that I have three different combinations of input features (magnitudes, angles, magnitude & angles), I compared the accuracy of each of the features. I randomly chose a test data, then trained the model with the remaining data and counted the number of false positives and false negatives. When the angles were used, there were no false negatives but false positive rate was high and detected all normal activities as falls. This was unexpected because the graphs of the angles showed large differences between the falls and non-falls. However, because using magnitudes as the only feature still provides accurate results, the low accuracy of angle features is not a big problem.
Next week, I am planning to add a visual component to the fall detection algorithm so that it is easier to demonstrate that the algorithm works. I will write a program that graphs the inputs and shows when a fall is detected. I will also get dummy data from Jacob next week and make sure that the algorithm works accurately with his data.
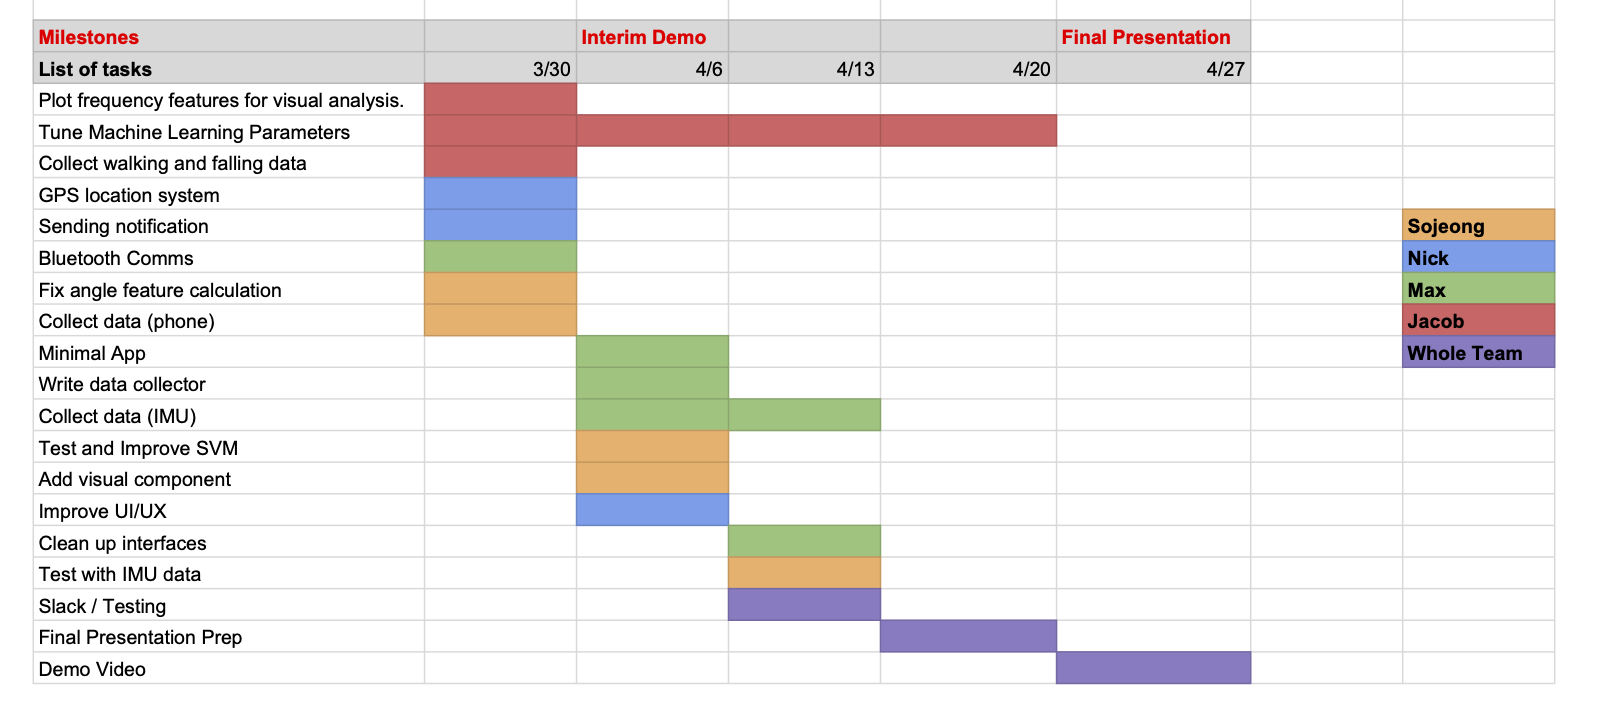
Updated Gantt Chart
Updated Risk Management
Data Collection :
Our major concern with the project is collecting the data set that is large enough to train our machine learning algorithm. In order to do this, we ordered a dummy to easily collect a large data set without us having to fall all the time. The test dummy is an easy way to collect data, but there is a risk that it might deviate from the data collected from actual humans. In order to mitigate this risk, we are also collecting the data of us falling.
Machine Learning Based Prediction :
Another concern was the low accuracy of the machine learning algorithm. In order to reduce the accuracy risks, we compared the SVM and RNN approaches to fall detection. We will also try training our model with a variety of preprocessed features (tuple of raw acceleration, magnitude, and angle) and find the feature combination and hyperparameters that achieve the best accuracy.
Hardware Compatibility and Accessibility:
At the outset, we anticipated that data collection and the accuracy of our ML approach would be the greatest risks. Now that we’re separated, data collection through our device is an even bigger problem, and so we’ve decided to begin collecting and tagging accelerometer data from our phones to supplement it. By configuring the discrete IMU a bit differently (50Hz datarate), we can match the data formats and provide both to the ML.
Ordering of Components:
We ordered all of the required components to complete the project successfully and by now they have been shipped to the relevant team members.
This week we discussed about our adjustments to the project as we all are required to work remotely because of the COVID-19 situation. Although the fall detection algorithm can be developed as planned, integration with the hardware component will be hard. To account for this situation, we decided to develop each component of the project separately. My goal is to develop a fall detection algorithm using SVM, but it will not be real time as planned before. Instead of using real time data from the RPi device as the input, I would have to use pre-collected data stream to simulate the real time inputs. A possible solution would be to set up a client-server connection using Python’s socket library, and make the client send data to the server at the same time interval as the collected data. The server can then run the classifier to detect falls. For demonstration, graphing the data stream and notifying when a fall is detected could show that the algorithm correctly detects falls.
My work is currently behind schedule because of the change of plans for the project. Next week, I will continue collecting data for the SVM using my phone. It would be best to collect data with our RPi device, but since the IMU sensors on RPi will provide more accurate data, I predict that the classifier will work as expected on the RPi if it works with the data collected from my phone. I will also have to come up with different ways to use phase data for classification as there was a concern about it being different depending on the orientation of the device. In addition to that, I will have to figure out how to use data stream as an input to the SVM, as the current version only supports importing data from csv files.
To adjust to the COVID-19 situation, our team decided to make some adjustments to our initial project. The MVP for our project originally intended to detect falls in realtime on the raspberry PI by the project deadline. The new plan is to prove the concept due to the difficulty in developing remotely or for multiple devices. Instead, we will record acceleration data on the raspberry pi and perform the machine learning analysis on an external machine.
Because the Raspberry Pi is not classifying the falls in real time as originally intended in the old plan, the new plan is to demonstrate the ability for the raspberry pi to make a bluetooth call to a smartphone to alert contacts. By demonstrating the communication framework we designed between the Pi, smartphone, and emergency contacts as well as the machine learning framework we designed for fall detection intended to eventually run on the Raspberry Pi in real time, we will successfully prove a proof of concept for our fall detection device. We are also going to order another Raspberry Pi and the sensors to set up the entire hardware component so that Max can use it for the hardware system development and Nick can use the other for testing the Bluetooth communication between the mobile application and the hardware.
Also, we decided to develop the mobile application with React Native instead of using the Android Studio. As we are working on our project remotely, Nick, who is responsible for the development, has only access to the iPhone. Since the React Native supports both Android and iOS platforms at the same time, once the application is released, another team member who has either an Android phone or iPhone can download it for the integration of the system later.
For data collection, our original plan was to collect data from people with different weights and heights to ensure that the data does not differ depending on people’s size. However, this became hard due to remote work, so we decided to have one person do the data collection. We also ordered a gym mat and a dummy for data collection before spring break, and we shipped it to Jacob so that he can use them for collecting data. The fall detection algorithm can be developed as planned, except that it will run on a computer instead of running on a Raspberry Pi. Our stretch goal would be to integrate the software component with the pi.
This week, I realized that using the phase of the accelerations as a feature can be problematic because it depends on the orientation of the device in the pocket. I was using the angle between the xy-plane and z-axis, but the axes could change if the user puts the device in different orientation. It could also lead to inaccuracy if the orientation of the device changes when the user moves. To handle this problem, I decided to use the change in phase over time instead of using the actual values of the phase.
Also, I added the magnitude and phase calculation to the code instead of doing it manually on excel for feature extraction. This was done to prepare for the integration with the RPi, as we would not be able to move the data received from the RPi to excel and do calculations there.
In terms of schedule, we are still on track.
After spring break, I will continue collecting more data and I hope to start getting data from the RPi and integrate them together.