Team Status Report for 12/06/2025

Accomplishments

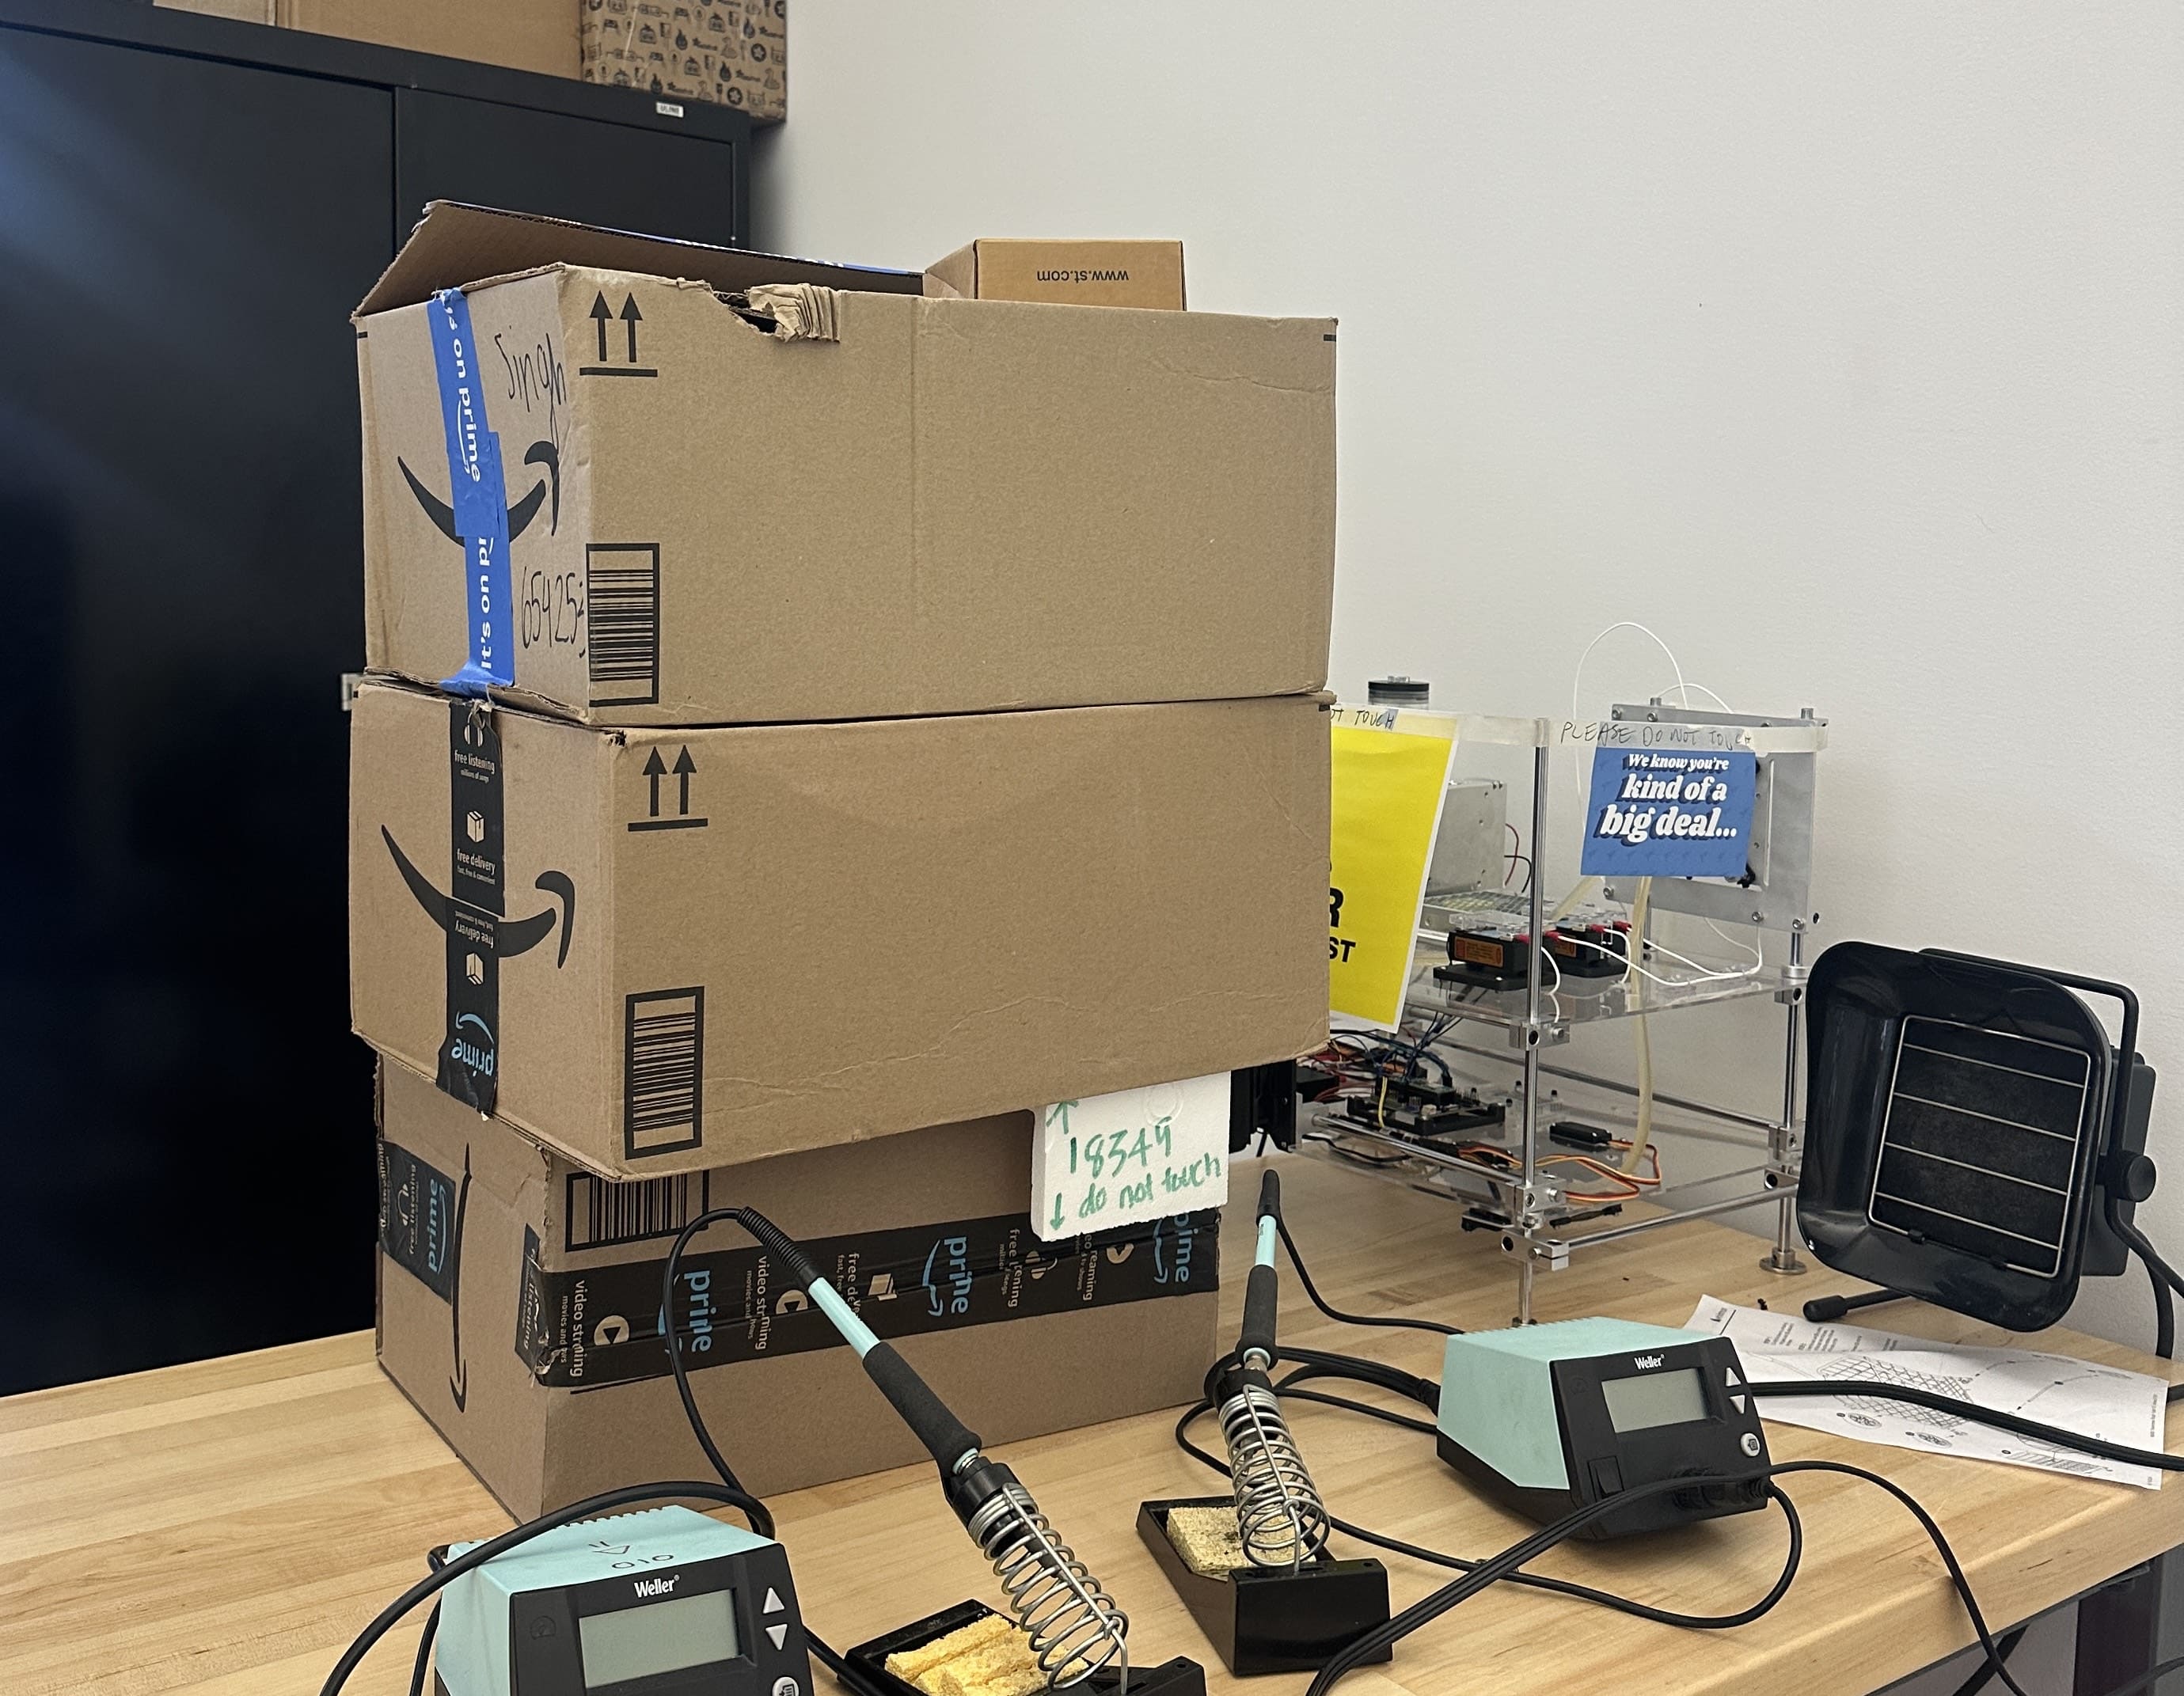
  • Testbed coolant flush: Flushed out cooling loop because of yellow fluid and contaminants
  • Data collection: Recollected normal dataset due to ambient temperature drift and coolant loop differences affecting inference
  • ML model development: Retrained regression and autoencoder using updated normal data
    • Updated autoencoder architecture to use delta temperature features only to lessen effect of ambient temperature changes
  • Final deliverables: Started planning Final Report, Video, and Demo
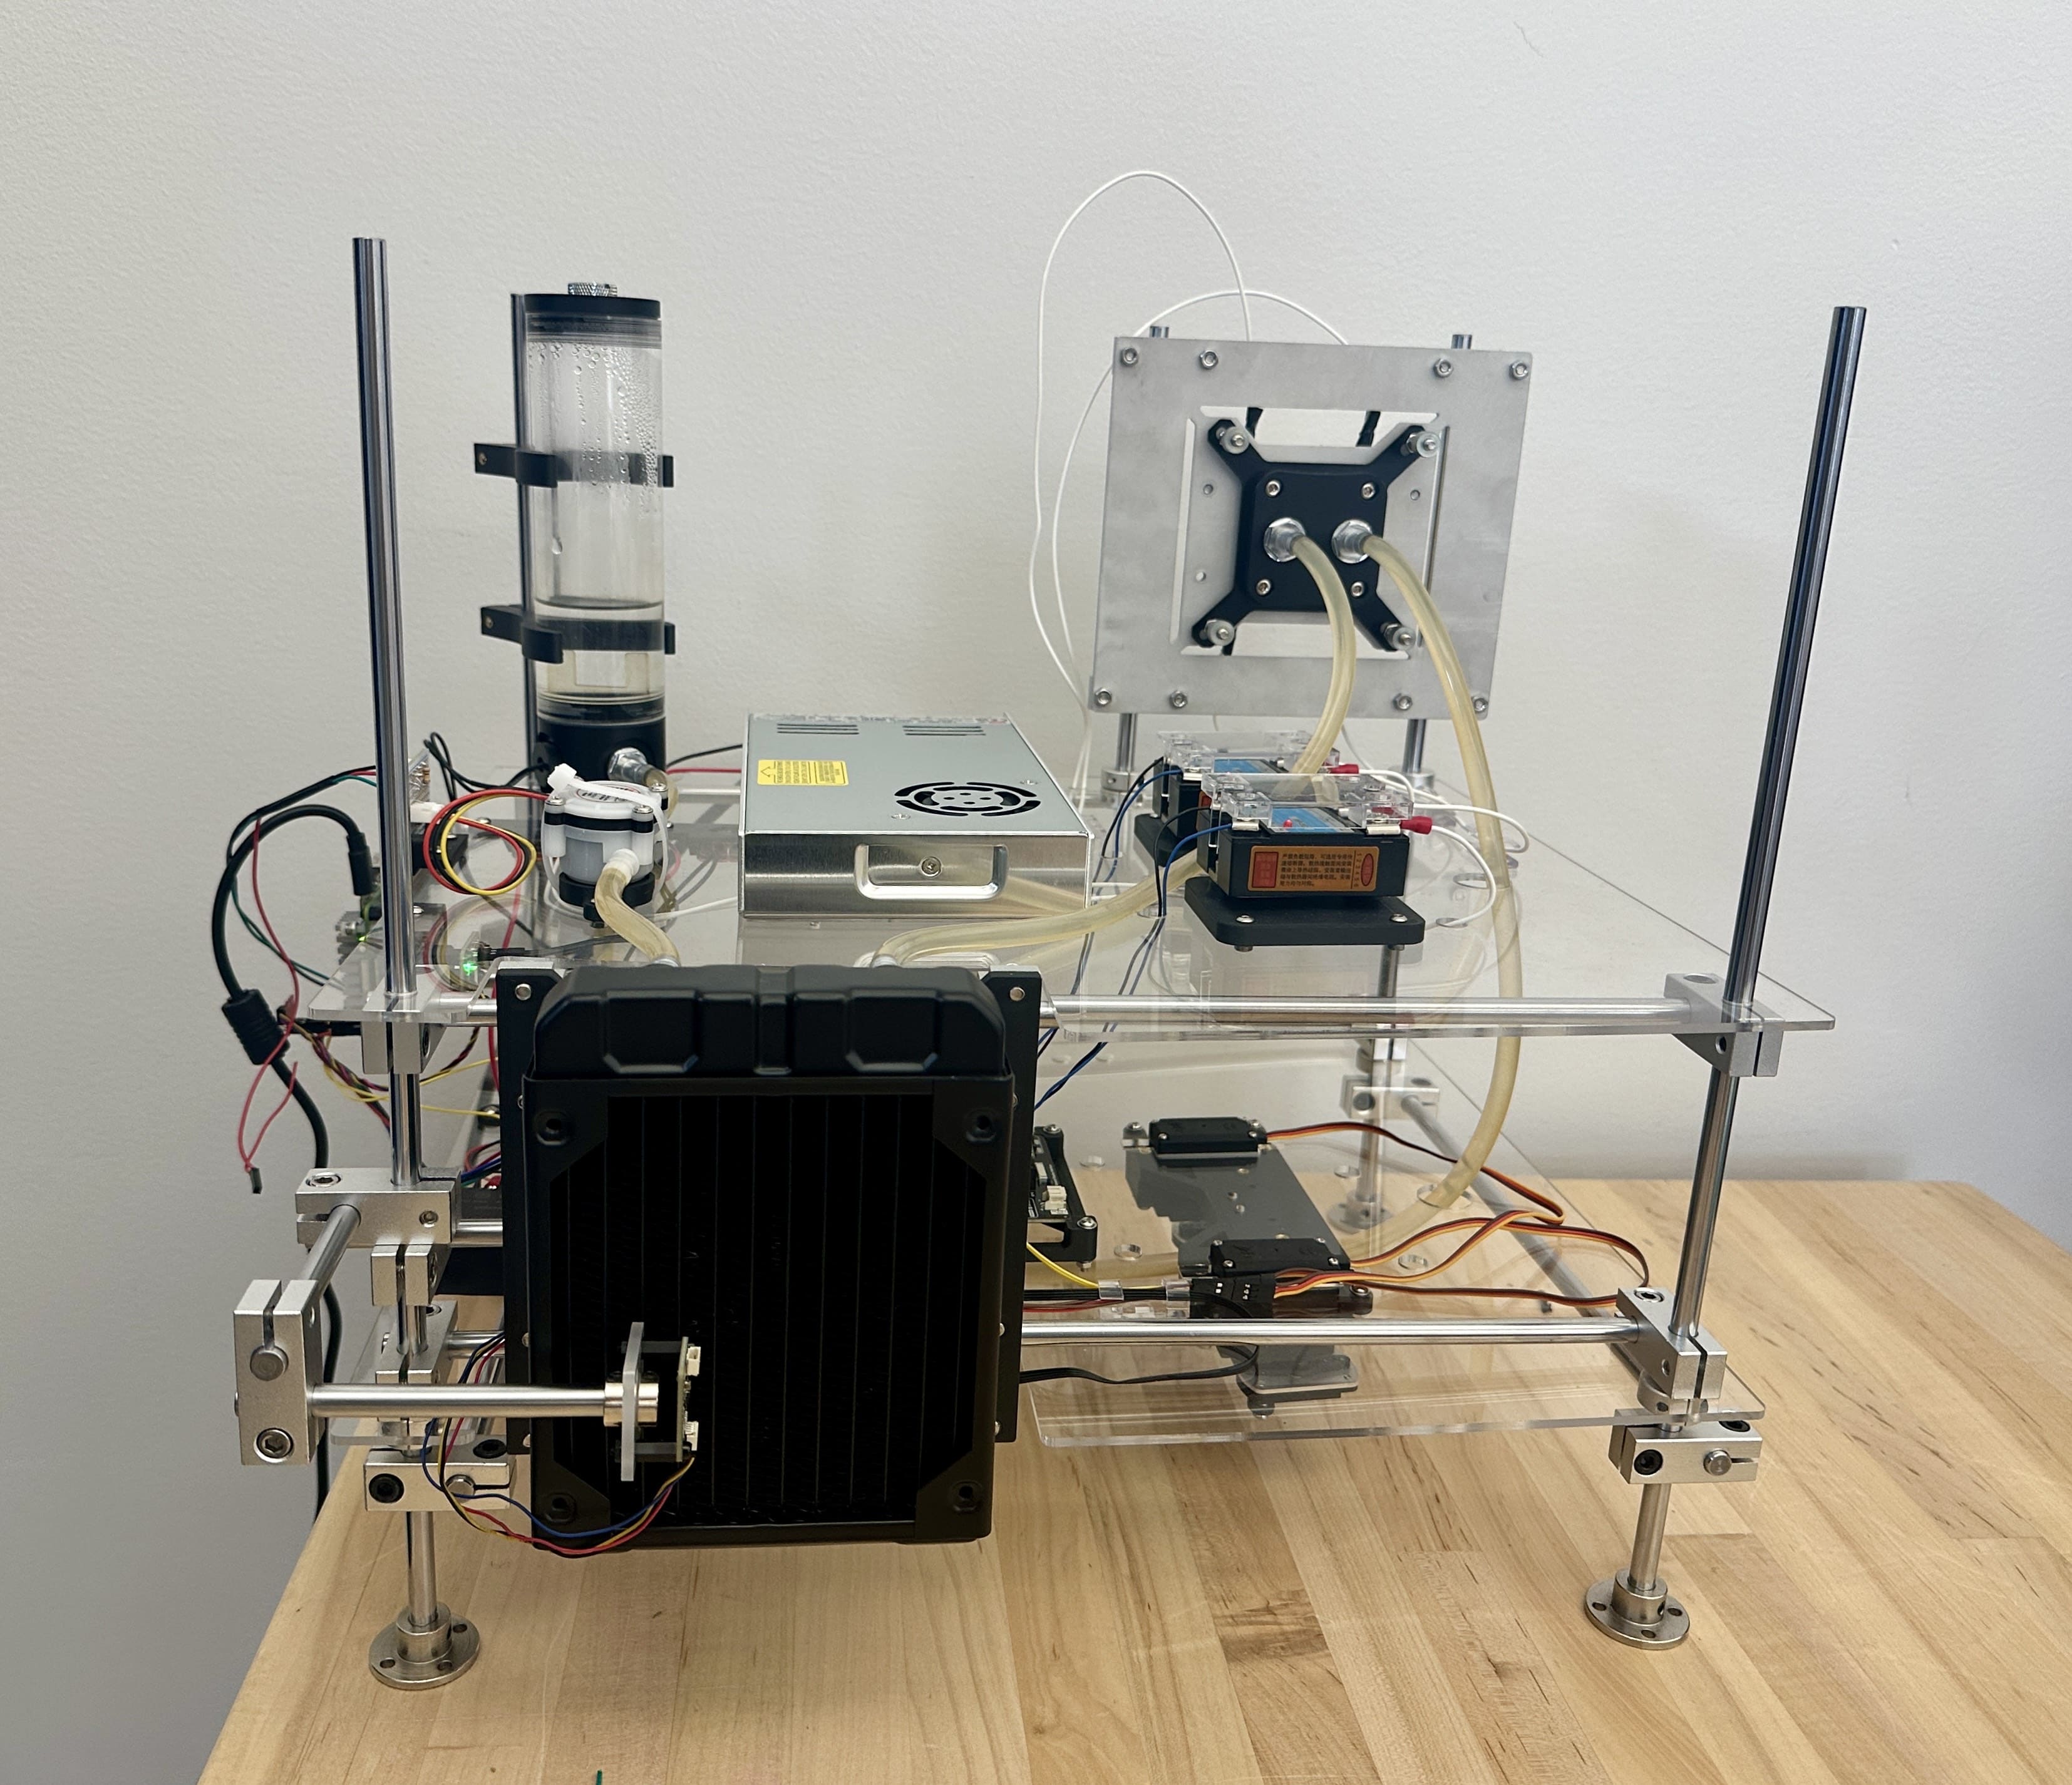
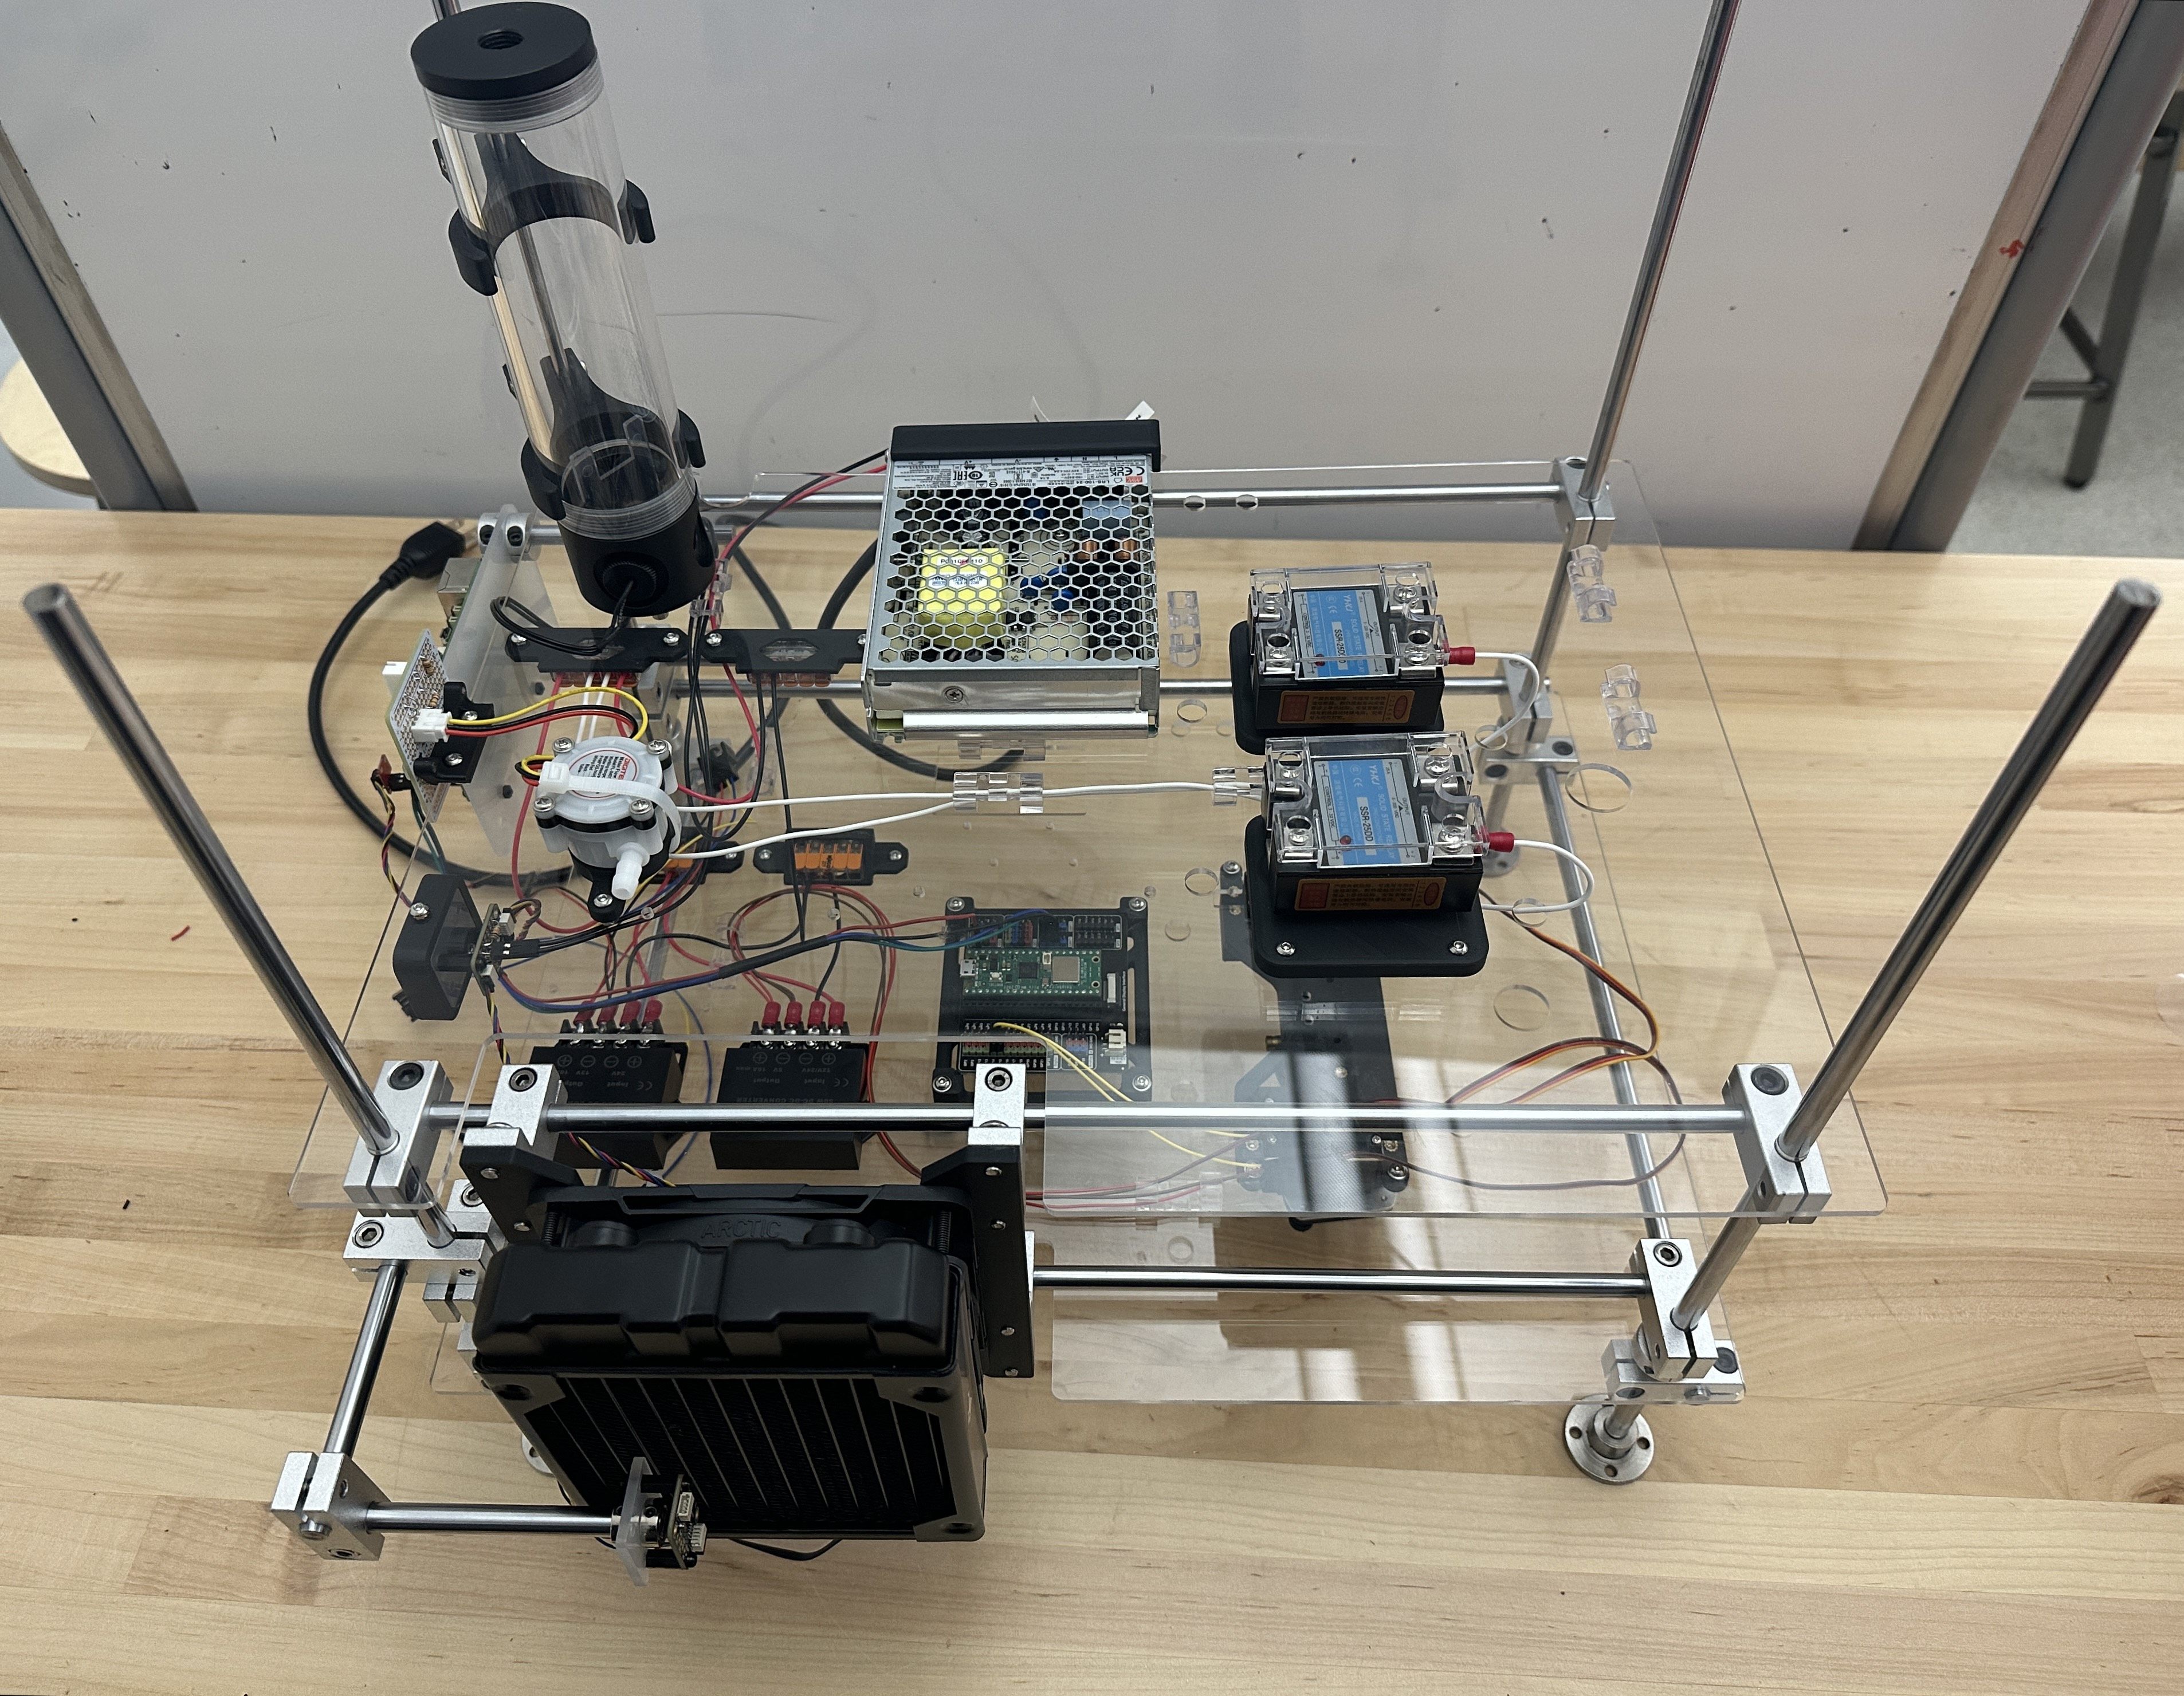
    • Took video of testbed for Final Video
    • Split up Final Report sections

Significant Risks

  • Model sensitivity: Since model is designed to detect small deviations, small drifts in ambient temperature, water levels, and other factors can cause the model to alert an anomaly
    • Switched to delta temperature only features (no absolute temperatures)
    • Tuned thresholds based on power levels

Design Changes

  • No major design changes this week

Schedule Changes

  • Project remains on track
    • ML model tuning in progress

Testing and Results

  • Servo Valve Flow Restriction Test: Ran servo through different PWM duty values and measured flow rate to map duty value to flow rate reduction
    • Result: Mapped duty value to flow rate reduction with fit equation
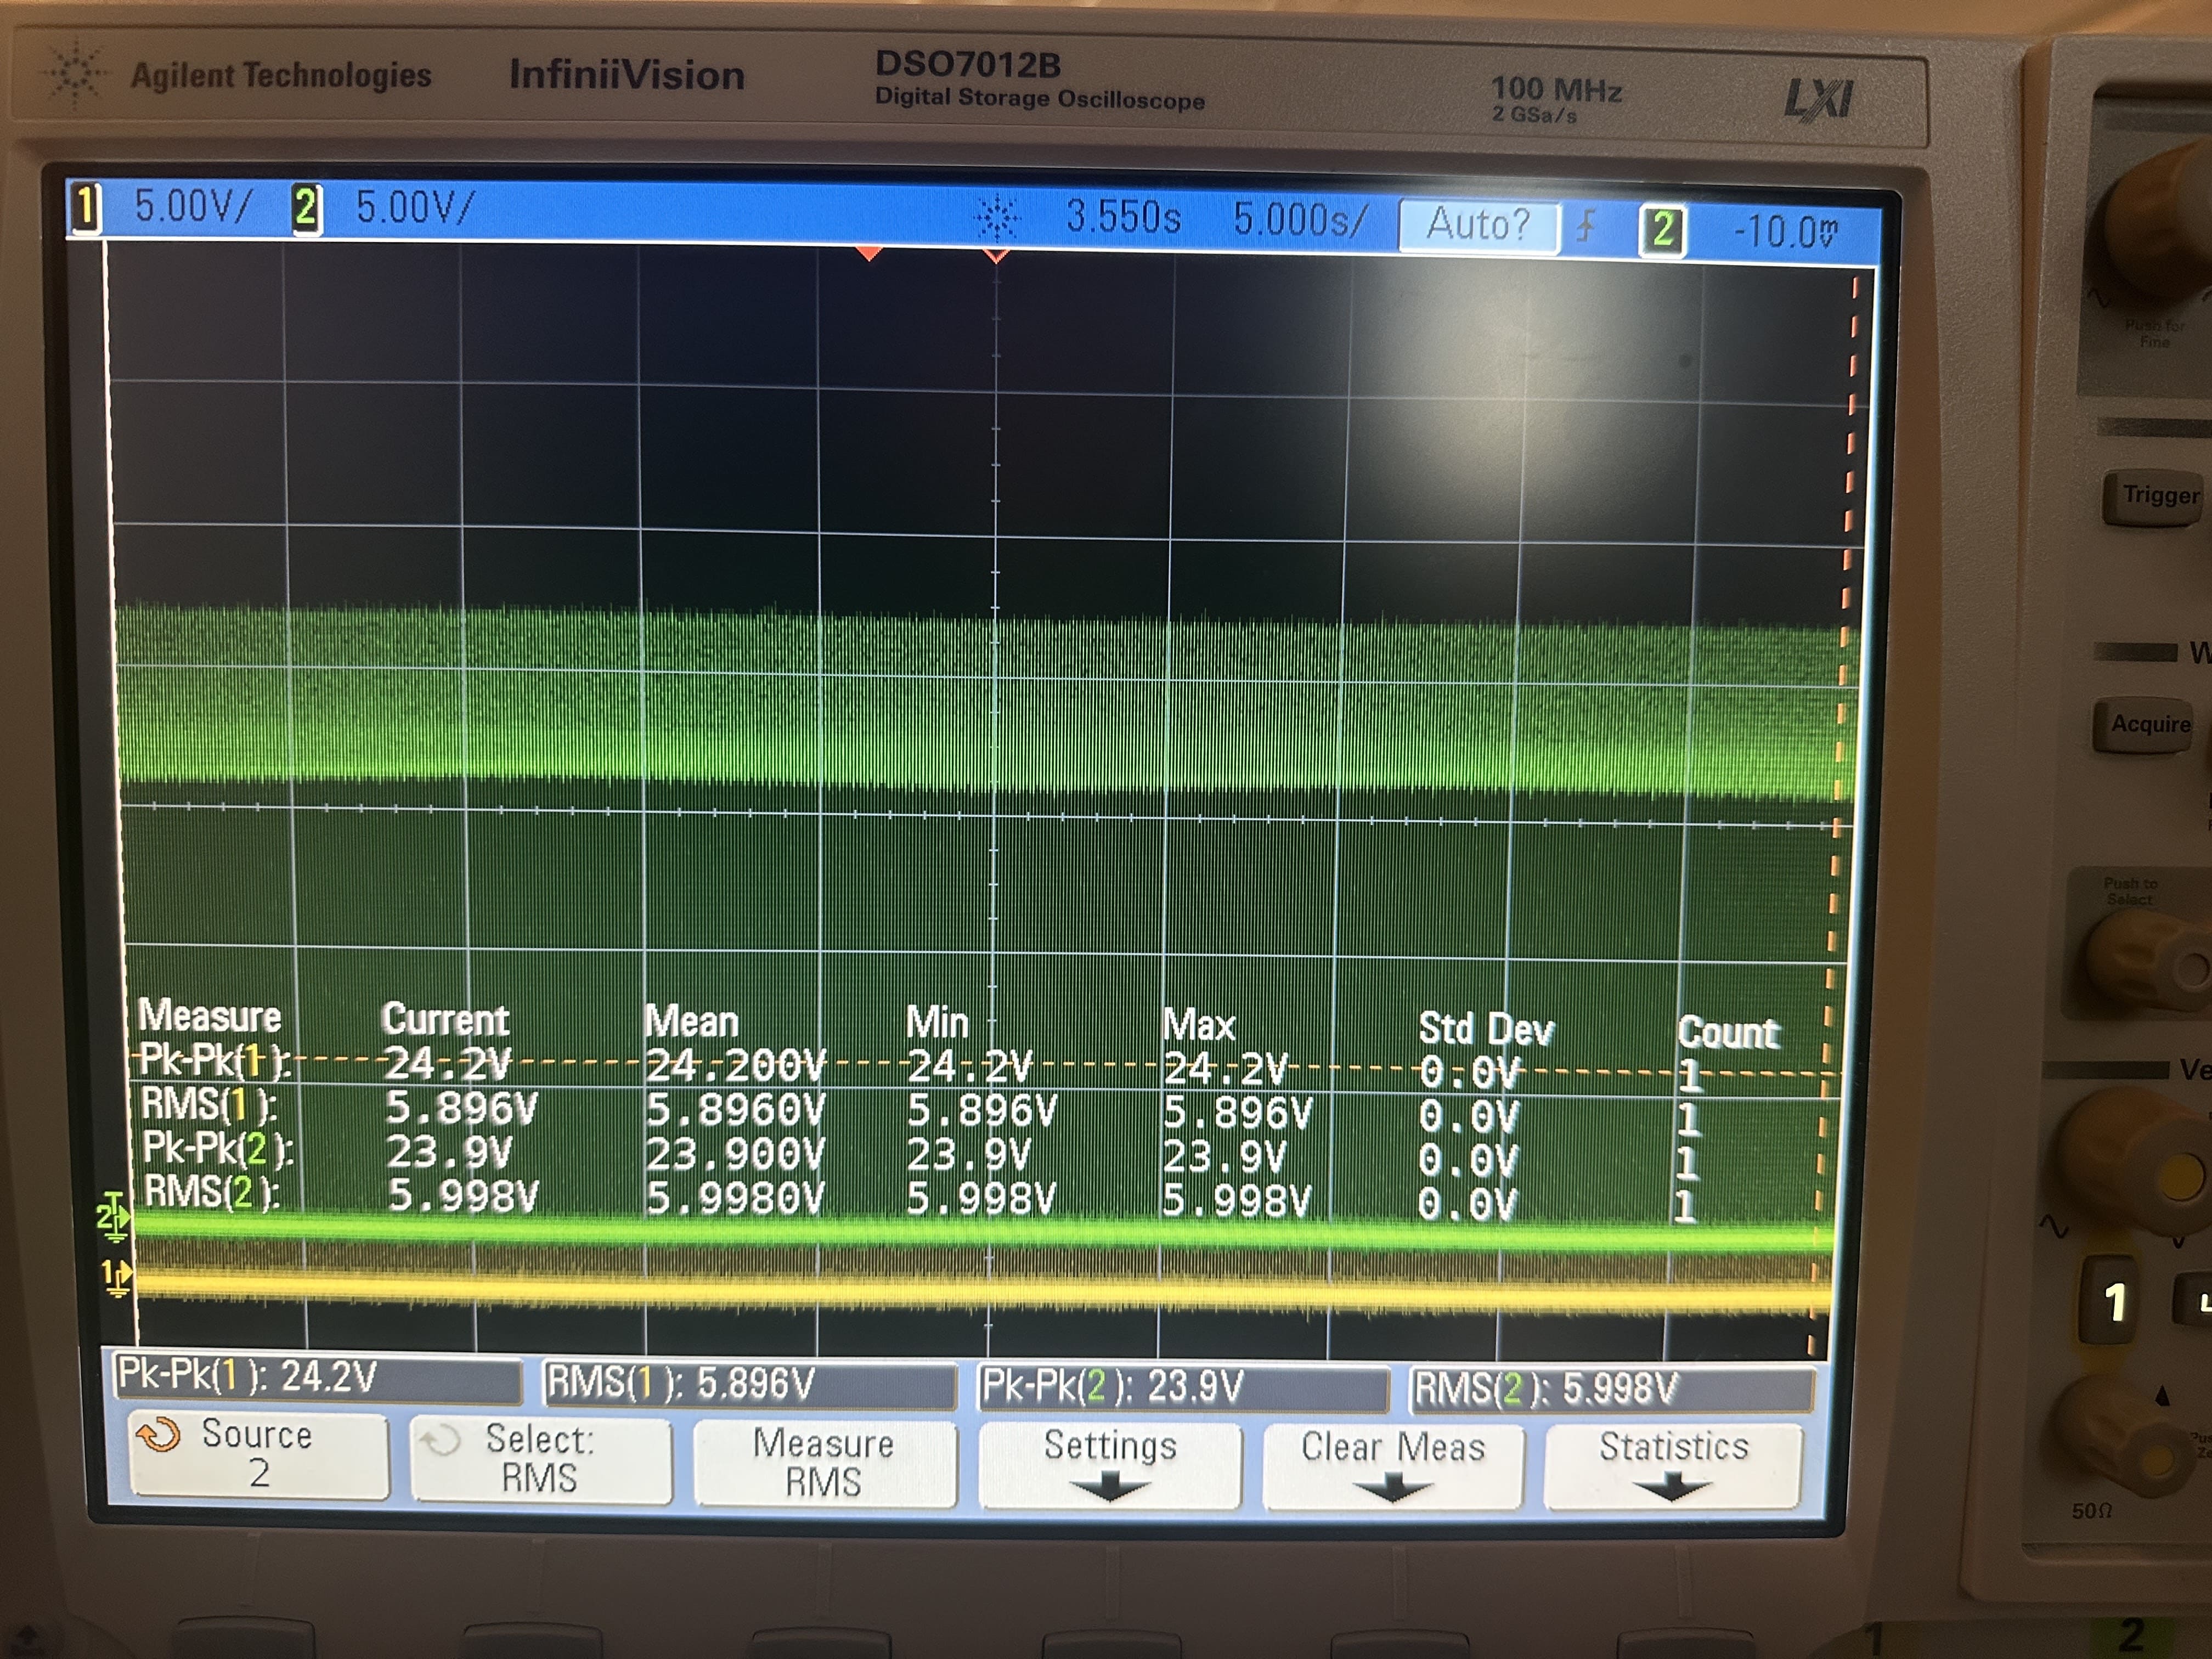
  • Heater / Power Delivery Test: Applied PWM values to the SSR and confirmed heater power using RMS voltage measured on oscilloscope
    • Design Change: Found that power supply rating too low and had to purchase higher wattage power supply (300W)
    • Result: Commanded power is accurate to actual measured Vrms
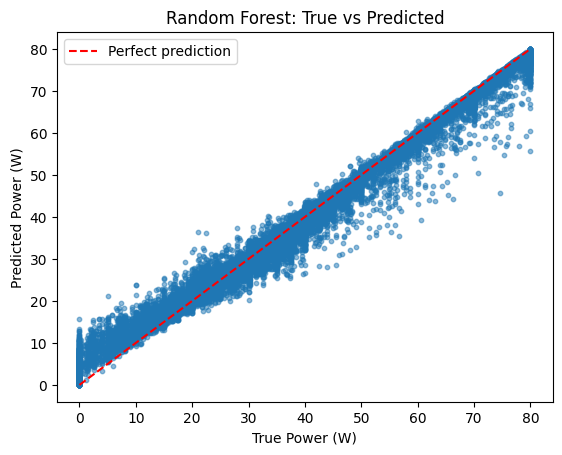
  • Regression Model Prediction Accuracy Test: Compared predicted vs. measured CPU power on normal datasets
    • Design Change: Replaced original linear regression model with a Random Forest after benchmarking several models
    • Result: Random Forest achieved RMSE = 2.53 W
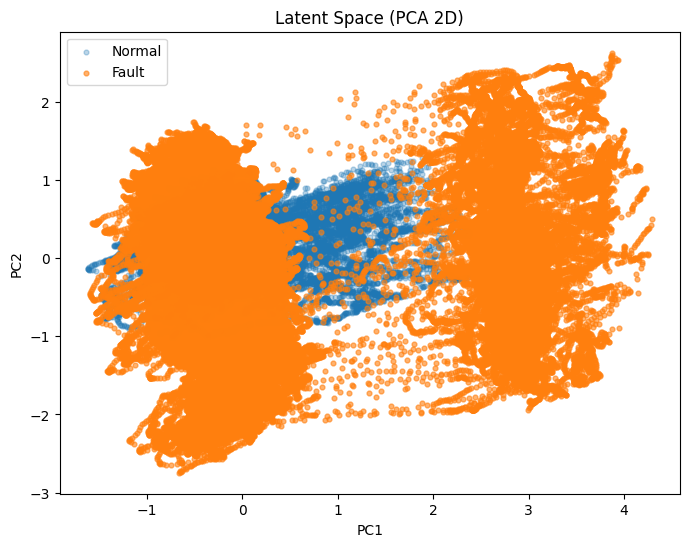
  • Autoencoder Model Latent Space Test: Examined latent space separation between normal and fault windows and measured FPR and FNR
    • Result: Model successfully differentiates normal from fault data
      • FPR: 0.38%
      • FNR: 0.64%
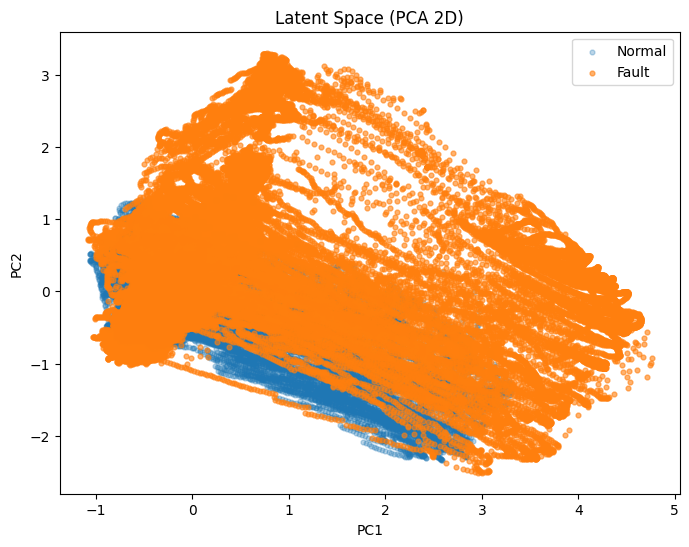
  • Classification Model Accuracy Test: Evaluated classifier performance on distinguishing flow faults vs. power faults
    • Result: Model successfully classifies flow fault and power fault
      • FPR: 0.00%
      • FNR: 1.06%
  • Latency Test: Measured timing from inference start to alert generation
    • Result: Model meets 1s latency requirement
      • Regression = 141 ms
      • Autoencoder = 363 ms
      • Classifier = 9 ms
      • End-to-end = 825 ms

Kristina’s Status Report for 12/06/2025

Recollected Normal Condition Data

  • Ambient temperature shifted noticeably from previous data collection runs
  • Repeated full normal data collection loop to collect data at current ambient temperature

Full Flush of Cooling System

  • Coolant turned yellow and contained some kind of brown particles, likely residue from radiator
  • Fully drained the loop, flushed several times, and replaced water

Retrained Model with New Dataset

  • Updated preprocessing steps, retrained regression and autoencoder models using new data
  • Updated model architecture to use only delta temperature features
    • Reduce model sensitivity to ambient drift
  • Began integrating updated models into live inference loop

Schedule & Progress

  • On schedule for final demo

Next Steps

  • Finish testing live inference loop
  • Complete final report and final video

Team Status Report for 11/22/2025

Accomplishments

  • Data Collection: Completed power-fault data collection
    • Started reduced flow data collection loop
  • Regression model: Finalized and validated model for predicting CPU power

  • Autoencoder anomaly detection model: Implemented AE using RF residuals
    • Completed initial tuning: window size, latent dimension, dropout, batch size
    • Implementing event based fault detection instead of window based to fix poor separation between normal vs. fault cases 
      PCA After Tuning

      PCA Before Tuning

Significant Risks

  • Normal fault overlap in AE latent space: PCA shows fault and normal windows are not cleanly separable even after tuning
    • Window level anomaly detection may be unreliable due to overlap
    • Risk mitigation: Switching to event-based detection, which only requires detecting a fault at least once per event

Design Changes

  • No major design changes this week

Schedule Changes

  • Project remains on track
    • ML model tuning in progress

Kristina’s Status Report for 11/22/2025

Data Collection for Fault Cases

  • Completed power fault synthetic test patterns
  • Started reduced flow synthetic test patterns data collection loop

Regression Model for CPU Power Prediction

  • Finalized feature set and preprocessing for regression model
  • Validated regression model performance on synthetic traces and exported model for use in autoencoder

Autoencoder Anomaly Detection Model

  • Implemented sliding window AE on RF output
  • Tuned initial architecture (window size, latent dimension, dropout, batch size)
  • Ran verification sweep on fault windows
  • Found strong overlap between normal and fault windows causing inconsistent fault detection
  • Developing event based detection: detect at least once per fault event rather than per-window

Final Presentation

  • Started drafting final presentation slides

Schedule & Progress

  • On schedule: working on tuning ML model

Next Steps

  • AE tuning + final presentation slides

Learning Strategies

  • ML autoencoder: Learned to build autoencoder for anomaly detection
    • Used Medium blogs, GitHub examples, and other people’s AE projects to understand typical structures and tuning strategies
    • Referenced scikit-learn documentation and online tutorials for scaling, windowing, PCA plotting, and general debugging
    • Already had background from ML classes but needed to apply to actual sensor data
  • Testbed Assembly: Had previous experience with similar setup with Raspberry Pi 5 and sensors so integrating was familiar
    • Had to learn how to run long data collection loops
    • Communicate between Pi and Pico over UART
    • Learn to flash code and debug UART on Pico with online tutorials and datasheets
  • Practical Skills:
    • Crimping connectors and assembling hardware setup
    • Used YouTube videos, forums, and online guides
  • Overall, most new knowledge came from informal learning
    • Videos, online blog posts, GitHub repositories, datasheets, and example projects

Team Status Report for 11/15/2025

Accomplishments

  • Hardware Upgrades: Replaced previous PSU with higher-wattage power supply for full-load heater testing

    300W PSU on Testbed
  • Testing & Data Collection: Began running automated test patterns including ramp up, ramp down, spike, and multi-level hold profiles
    • Completed synthetic data collection patterns covering full power range (20-80W)
  • CPU Power Trace: Collected power trace from a laptop using HWiNFO to generate realistic workload profile for testbed
Updated Testbed Assembly

Significant Risks

  • Interference from Other Classes: Embedded systems class is storing large boxes directly in front of testbed’s intake fan area
    • Obstructions may alter airflow, reduce heat dissipation, and affect temperature sensor readings
    • Risk mitigation: Hope that embedded will move boxes soon
Amazon Boxes Blocking Testbed Fan

Design Changes

  • No major design changes this week

Schedule Changes

  • Project remains on track
    • Synthetic data collection now complete for normal operation
    • Running real traces

Kristina’s Status Report for 11/15/2025

Hardware Updates & Repairs 

  • Replaced previous PSU with a higher-wattage supply to start full-load heater tests
  • Fixed issue where screw heads completely de-threaded
    • Used pliers to remove and mount new PSU
  • Verified stable operation of power output with new PSU

Data Collection & Testing

  • Began running automated synthetic test patterns, including:
    • Ramp up and ramp down CPU power profiles
    • Step spikes
    • Holds
  • Debugged issue where tests suddenly stopped mid-run
  • Finished a complete sweep of synthetic data collection
  • Collected real CPU power traces using HWiNFO on my laptop to simulate realistic user workloads
    • Imported traces into power traces and successfully began running them on testbed

Schedule & Progress

  • On schedule

Next Steps

  • Begin processing data
  • Start building regression model to predict power output
  • Start fault-condition runs to collect fault data for anomaly detection

Team Status Report for 11/08/2025

Accomplishments

  • System Integration: Completed integration of all major components, including pump, heaters, fan, sensors, and servos
    • Verified basic operation of each subsystem
    • Integrated Pi 5 and Pico code for synchronized control commands for SSR, fan, and pump through UART
  • SSR Calibration: Used oscilloscope testing to characterize relationship between PWM duty cycle and power output

    Using Oscilloscope to Measure Vrms of SSR Output to Resistors
  • Data Collection Pipeline: Completed logging of temperature, RPM, and power data from sensors and Pi 5 commands into InfluxDB

    Grafana Dashboard of Temperature Readings
  • Started preliminary data collection using constant power hold tests (20-40W)
  • Flow Calibration: Mapped duty cycle values to flow reduction rate %
    • Used oscilloscope to debug flowmeter reading problems

      Using Oscilloscope to Measure Flowmeter Output to RPi5 Input GPIO Signal

Significant Risks

  • Limited Data Collection Time: With only a few weeks left in the semester, there is limited time to gather a large enough dataset for ML model training
    • Risk mitigation: Run automated, continuous overnight tests and streamline test sequencing to maximize data volume
  • Power Supply Limitations: Current power supply does not provide enough wattage for full-load operation
    • Risk mitigation: Acquiring a second power supply with higher capacity to support higher power testing

Design Changes

  • No major design changes this week

Schedule Changes

  • Schedule adjusted to allow additional time for data collection
  • Project remains on track, with initial data collection underway

Kristina’s Status Report for 11/08/2025

Hardware Integration & Testing

  • Finished full testbed assembly
  • Started testing on actual hardware setup (pump, fan, heaters, sensors all active)
  • Verified operation of all components under load

SSR Calibration

  • Conducted oscilloscope testing to measure duty cycle vs. output power
  • Derived a linear equation relation PWM duty value to wattage output
  • Updated control code to use calculated duty values

Integration

  • Finished integrating UART communication between Raspberry Pi 5 and Pico
  • Verified that heartbeat and command messages correctly sent and received

Schedule & Progress

  • On schedule
    • Debugging hardware issues and calibration tasks from last week have been resolved
  • System now ready for automated data collection testing

Next Steps

  • Write and test automated data collection routines on the Pi 5
  • Begin extended test runs to log data continuously
  • Start ML code development

Team Status Report for 11/01/2025

Accomplishments

  • Testbed Assembly: Completed assembly of the basic testbed
  • Pump Mounting: Began mounting the pump but encountered alignment issues
    • Explored alternative mounting solutions to secure it properly
  • Aluminum Board Fabrication: Threaded and sanded the aluminum mounting board for the resistors to prepare for assembly
  • PWM Testing: Performed initial PWM testing on the fan
    • Confirmed PWM control
    • Plan to start pump PWM testing once full water loop is assembled
  • Sensor Integration: Completed sensor wiring and testing
    • Successfully read data from the TMP117 temperature sensors and the ADS1115 ADC used for coolant temperature sensor through the RPi5

Significant Risks

  • Pump Mounting Delay: Assembly progress was slowed by misalignment in the pump mount
  • Risk mitigation: Plan to either zip tie pump to acrylic board or use thread reducer to fix alignment issues

Design Changes

  • No major design changes this week

Schedule Changes

  • Schedule remains the same
  • Project remains on track to begin integration next week

Kristina’s Status Report for 11/01/2025

Testbed Assembly

  • Assembled the basic testbed and power routing
  • Brainstormed alternative ways to mount pump
Partial Assembly

Schedule & Progress

  • Slightly behind schedule due to fit issues with the pump mount
    • Mounting holes did not align
  • Exploring alternative mounting solutions to get back on schedule

Next Steps

  • Complete water loop assembly with tubing
  • Begin SSR PWM control testing with Pico once loop is complete
  • Add resistor and water block assembly for load simulation