Kayla’s Status Update for November 14th
This week I dove into applying different data dimensionality reduction and classification methods to our data. First, with the primary data that we have collected, I created a visualization of the peaks of the recorded signal data in order to see if there might be any obvious trends in the correlation between movements and the peak of their signals.

This graph shows the max value for the voltage recorded by each electrode for each sample of each movement from the preliminary set of data.
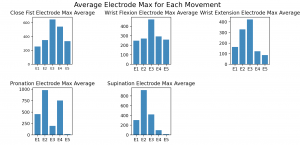
This graph shows the average of the max value for the value recorded by each electrode for each movement in the preliminary set of data.
Next, I performed PCA on the data to reduce dimensionality and find the greatest principle components on which to project the data. Then I applied Long Short-Term Memory classification to the data because I wanted to attempt classification of the time series data. I hope to continue this work by developing a feature vector to be classified by a neural network. The majority of the project is on track, but the following week will continue with the data classification phase of the project in order to be integrated into the rest of the system.