This week, I was able to begin the evaluation and fine-tuning of a few out of the box YOLO object detection models. More specifically, I used the YOLOv8x, which is a large, high performance model trained on the COCO dataset.
For evaluation, we were advised to be wary of the robustness of the object detection models with regards to its performance on out-of-distribution data, as previous teams have run into difficulty when trying to use the models in a real world setting. Since the validation metrics of the model on the COCO dataset are already available online, so I decided to use the validation set of the BDD100k dataset to determine the level of performance decay on a out-of-distribution dataset to mimic performance in a real world setting.
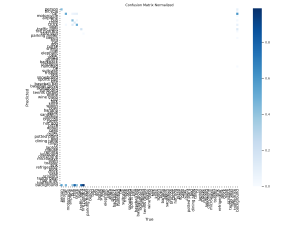
So far, it appears that the out of the box model does reasonably well on the new dataset out of distribution. I first generated a confusion matrix to examine how well the model does on each class. Note that our evaluation dataset only contains the first 10 labels of the YOLO model, and so only the top left square of the matrix should be considered in our evaluation:
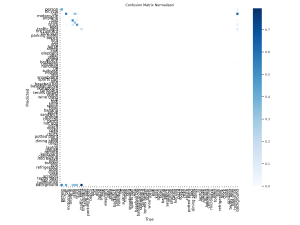
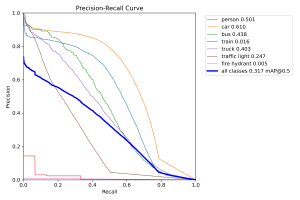
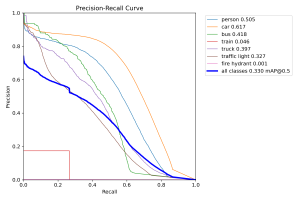
It appears that the model mistakingly assigns a “background” label to some images that should be been classified as another item on the road, which is especially troublesome for our use case. Besides this, the accuracy appears somewhat reasonable, with some notable off-target predictions. I also generated a precision-recall across the different classes:
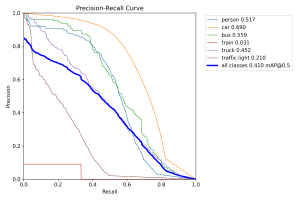
It appears that the model struggles most with identifying traffic lights and trains. However, in our use case of crossing the road, these two objects are definitely less important to detect in comparison to the other categories, so I’m not personally too worried about this. As a whole, the mAP metrics across the other labels seem reasonable compared to the reported mAP metrics of the same models on the COCO dataset. Considering that these models weren’t trained on this new BDD100k dataset, I’m cautiously optimistic that they could perform well in our testing as is, even without extensive fine-tuning.
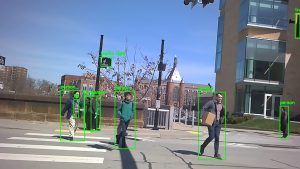
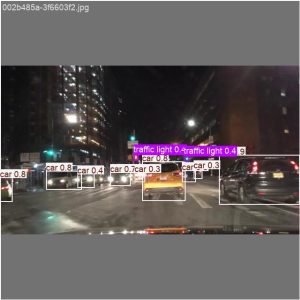
Finally, I generated a few example images with the model predictions overlaid to visually depict what the model is doing. Here is an example:

The top picture are the images with the reference labels,

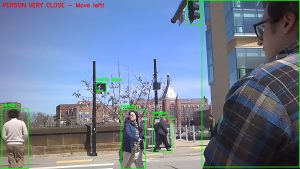
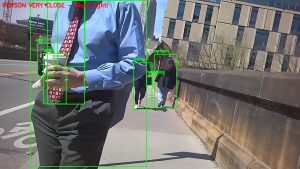
and the bottom picture are the same images with our model predictions overlaid. On the top row, the second image to the left stood out to me, since our model detected trains where there weren’t any. To me, this might be an interesting dive point into why our model does so poorly with regards to detecting trains, although given that we have established that trains aren’t as important in our use case, we might not need to do a detailed analysis if time is tight.
With regards to progress, I believe that I am about on track as per our Gantt chart; I have been able to complete preliminary evaluation of the object detection models, and I have also started implementing a fine-tuning pipeline, in order to incorporate more datasets into the out of the box models we are currently using.
Next week, I plan on moving into the second part of my deliverables; writing out a pipeline to handle the outputs from our model with regards to navigation. I plan on brainstorming how to make proper use of the detection model inputs, as well as how they should be integrated into the larger navigation module that we have planned. I also plan on gathering some more datasets such that I can make use of the fine-tuning pipeline I already have implemented to develop even better object detection models, such that we have a wider array of options when we are ready to our integrated project.