
Kaitlyn’s Status Report for 4/26

Carnegie Mellon ECE Capstone, Spring 2025 – Lilly Das, Cora Marcet, Kaitlyn Vitkin
What are the most significant risks that could jeopardize the success of the project? How are these risks being managed? What contingency plans are ready?
At this point, there aren’t many major risks with the project as we’ve taken care of most of them. Remaining risks include persistent errors in the neck angle (really, head angle) calculation greater than 5 degrees past the 30-minute mark. This is being managed by additional testing after making an adjustment to one of the process noise parameters of the Kalman filter model. Unfortunately, these tests and the accompanying data processing do take a lot of time so the amount of iteration that can be feasibly done to optimize these parameters is somewhat limited. Not too concerned as current tests have yielded pretty low errors.
Were any changes made to the existing design of the system (requirements, block diagram, system spec, etc)? Why was this change necessary, what costs does the change incur, and how will these costs be mitigated going forward?
No changes at this point!
Provide an updated schedule if changes have occurred.
Still testing and making the final adjustments for the demo 🙂
Testing Pt. 2!
List all unit tests and overall system test carried out for experimentation of the system. List any findings and design changes made from your analysis of test results and other data obtained from the experimentation.
Unit Tests (carried out so far):
Overall System:
Things done this week
Progress?
Deliverables for this week, mostly before the demo:
Here’s a link to long-awaited testing results (as of now) if you would like to see them:
Explanation of graphs:
This week I gave the final presentation, so preparing this presentation took up a lot of my time this week. Additionally, I worked on the graph display for the neck angle data, which we were able to get working. Next week, I would like to test receiving inputs for both the blink rate and the neck angle at the same time and make sure these graphs can both update correctly at the same time since although we have tested them separately we haven’t yet tested them together. I want to get this done before the final video on Wednesday and final demo on Thursday so that I can demonstrate this functionality then.
I am on schedule this week. Next week I hope to test the browser extension to see how it does with multiple inputs and make sure it still works properly as well as make the browser extension a little more pretty probably with adding CSS to the HTML for the popup.
Things done this week:
Progress?
Still in testing/benchmarking/tweaking mode since debugging stuff with the angle calculation took a little longer. The results from the first 2 testing sessions should be out today but I thought I’d type up this status report first.
Deliverables for next week:
Learning?
I got a lot more familiar with the Arduino IDE and Python programming to get all the coding done for this part of the project. Luckily there were a lot of relevant Arduino libraries (particularly for bluetooth control and sensor drivers) so I was able to modify much of the example code to make it work for this application, along with adding the extra things I needed. I also learned about different angle estimation methods, including complementary, Kalman filters, and just doing trig on the acceleration vectors. This involved reading a lot of forum posts about the filters, and papers comparing the methods/explaining their disadvantages and advantages. Another thing I learned was how to use HTTP post and get requests, since I had never done that before and we needed a way to send data to and from the server. I learned this from my teammates, googling, and guess-and-checking with print statements to debug. One tool that I learned about for this project was Kinovea, which isn’t actually great for automatically tracking angles but that’s fine since I’m just going to manually measure them using the software anyway. The docs for Kinovea and the user interface are fine so I didn’t have to do much external research to figure out how to use the tool.
No images since I haven’t processed/analyzed my data yet :,,)
Here is a snippet of a testing session to demonstrate the setup: https://drive.google.com/file/d/1BQTXiCdb4EkZl6gPwkAzyboGbDKy8ZFB/view?usp=sharing
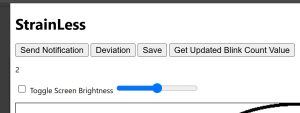
This week, I focused in on testing the sensors and insuring their robustness for different users. As previously mentioned, I had overtrained the algorithm based on my own testing, so I spent this week gathering the data needed in order to improve the algorithm. After gathering a lot of data, I was able to infer two major things: I should move the position of the sensors inwards to the center of the chair, and that the difference in accuracy I was seeing was based more on the height of the chair I was using. I found that by raising the chair off the ground to simulate what an office chair is like (where peoples legs and knees are not pushed past a 90 degree angle), I was able to get much more accurate results on when people were deviating from their baseline posture. As well, moving the sensors in closer together helped get overall more data from users with different sitting positions, as it was more likely that their weight was distributed over the sensors. However, this is one of my biggest tradeoffs. We wanted to have direction of lean be part of the alert that the user is receiving, but in order to get the accuracy of alerts when deviating from baseline, I needed to not send the direction of the lean. Specifically, this means that while the accuracy of when to send the notification is very high, the heat map (which was a stretch goal) will not always be accurate. I also began to work on the Final Presentation slides.
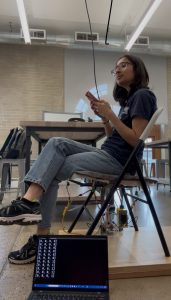
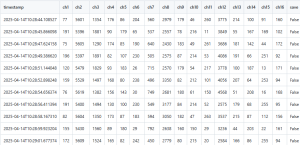
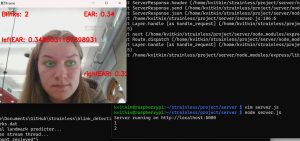
Lilly testing the seat module – the [0,0,0,1] means the algorithm has detected an incorrect posture (in this case the crossed legs paired with the lean back). She was testing different positions for ~5 minutes, and the video recorded her posture and how the algorithm processed it.
My progress is on schedule, as I will continue testing this week and making any modifications I need. This upcoming week, I will focus on testing with many more users for extended periods of time (more than the 5-10 minutes of my current tests). Specifically, I want to see how well the averaging of the data for other people works over an extended period of time.
As I have worked on our capstone project, I have learned quite a bit of new information. This was my first time properly working with an RPi, I had to learn to properly use the ssh / setup virtual environments in order to properly run code. As well, this is the first time I have written any sizable program in Python, as almost all of my past projects and experience have been in C/C++/Java. I learned mainly through looking at the datasheets and adafruit guides, as well as figured out errors through reading forum posts. I also used javascript for the first time, which Cora helped me with. As well, I learned how to laser cut to make our overall box which holds all the components.
This week I worked on debugging the security issues that I was facing with the iframed graph display script for the blink rate/neck angle data. I was able to get these security issues figured out by adjusting the csp policies of the sandboxed html in the manifest.json file.
Here is an image displaying a sample graph which is iframed into the extension’s html. I was additionally able to get communication between the extension code and the sandboxed code via postmessages which is good since this allowed me to update the graph data with the information I’m getting from the server with updated blink rate/neck angle data.
Additionally, this week we worked on our final presentation. My progress is on schedule, although I would like that the graphs automatically update (right now the user has to click on a button to update the graph). I want to get this figured out before the final presentation next week so that we can display this functionality during the presentation.
As you’ve designed, implemented and debugged your project, what new tools or new knowledge did you find it necessary to learn to be able to accomplish these tasks? What learning strategies did you use to acquire this new knowledge?
I relied on a lot of online documentation from Chrome for developers and JavaScript/HTML/CSS in general during this project. I had some experience making extensions in the past but this project required a lot of functionality I did not have experience with, such as I have never tried to send requests to a server via a Chrome browser extension before. I also found it helpful to look at GitHub repos for other extension projects, such as there was a repo I used to learn how to adjust the brightness of the user’s screen.
The most significant risks in regards to the pressure sensing is sensor inaccuracy. Specifically, while getting the sensors to work for a singular person isn’t difficult, but it is hard to adjust the parameters so that they are universally applicable. In order to mitigate this risk, Kaitlyn is tuning the sensors and updating the algorithm so that it is more general and work with as many people as possible.
The most significant risk for the neck angle sensing is that the gyroscope has too much drift and will effect the results over long periods of time of use, such as 1+ hours. In order to mitigate this risk, Lilly is doing additional calibration and fine tuning to the kalman filter which she is using to process the neck angle data.
For the browser extension, the most significant risk right now is getting the displays working seamlessly without the user having to click buttons in order to update data in the graphs. In order to update the graph displaying blink rate right now, the user has to click a button, which works well since Chrome extensions are event-driven. Cora is mitigating this risk by making it so when the user opens the browser extension, it automatically makes update requests so the user doesn’t need to do this themselves.
There have not been changes to our design nor are there updates to our schedule. We are trying to do as much testing right now as possible before the final presentation next week so that we can display at the very least functionality of our product during the presentation.
Last week I worked on getting the blink rate integrated with the server and the browser extension. I’m running the python script locally which calls the OpenCV library which enables us to collect blink rate. This data is shared via a HTTP request to the server which shares that data with another HTTP request with the browser extension.
This is a picture of the python script running (note that the user will not see this in our final product but it will run in the background). Note the blink rate is at 2.
This is a picture of the browser extension. After requesting to get the blink rate from the server via the “Get Updated Blink Count Value” button, the HTTP of the extension was updated and “2” was displayed.
This week I worked on further integration with Lilly on the browser extension and the neck angle. Additionally, I am currently working on getting the graph display for the blink rate working. I’m running into some issues with using third party code which is necessary in order to make graphs. My solution which I’m debugging at the moment is to sandbox the JavaScript which uses the third party code in order that we can use this code without breaking Google Chrome’s strict security policies regarding external code.
I am on track this week. I think after getting the graph UI working the browser extension will be near finished as far as basic functionality and the rest will be small tweaks and making it look pretty. I’m hoping to reuse the graph code to display neck angle as well so once I get it figured out for the blink rate this shouldn’t be an issue.
What are the most significant risks that could jeopardize the success of the project? How are these risks being managed? What contingency plans are ready?
Were any changes made to the existing design of the system (requirements, block diagram, system spec, etc)? Why was this change necessary, what costs does the change incur, and how will these costs be mitigated going forward?
Provide an updated schedule if changes have occurred.
It seems we have arrived at the “slack time” of our original schedule, but we are in fact still in testing mode.
System Validation:
The individual component tests (mostly) concerning accuracy (reported value vs. ground truth value) of each of our systems have been discussed in our own status reports, but for the overall project the main thing we’d want to see is all of our alerts working in tandem and being filtered/combined appropriately to avoid spamming the user. For example, we’d want to make sure that if we have multiple system alerts (say, a low blink rate + an unwanted lean + a large neck angle) triggered around the same time, we don’t miss one of them or send a bunch at once that cannot be read properly. We also need to test the latency of these alerts when everything is running together, which we can do by triggering each of the alert conditions and recording how long it takes for the extension to provide an alert about it.